



Abstract
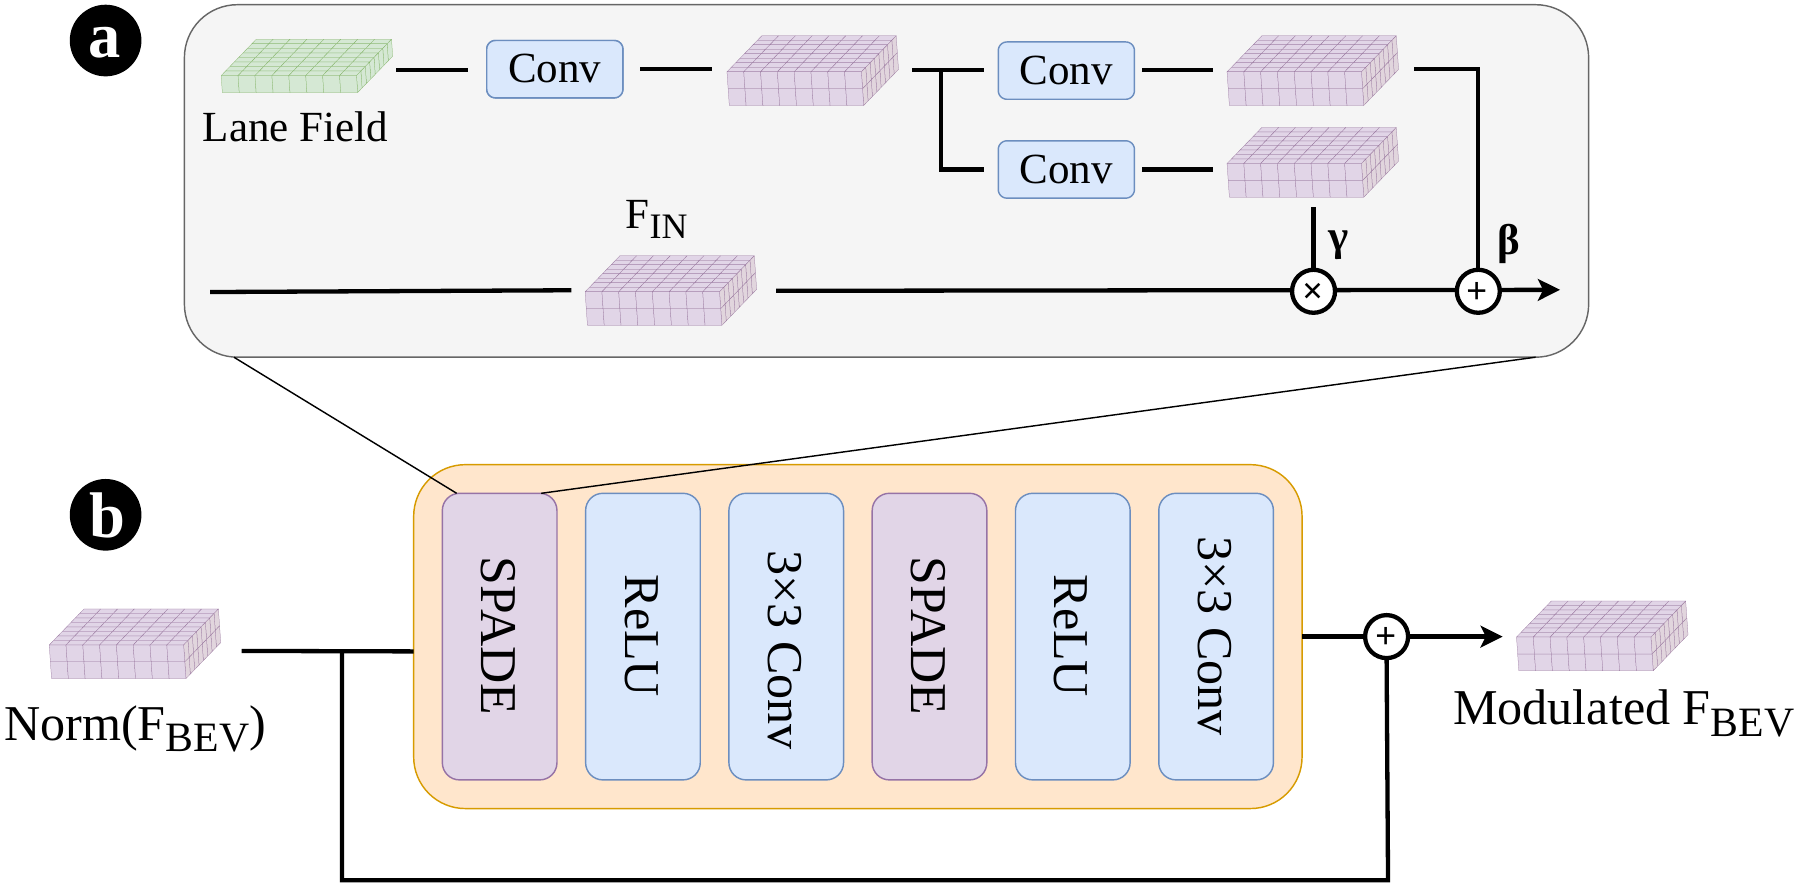
High-definition maps provide critical structural information for downstream autonomous driving tasks. Recent methods increasingly rely on external priors to improve prediction accuracy and robustness. Yet, existing prior representations expose a trade-off: dense rasters are easy to integrate but ignore certain map geometric properties, while sparse vectors preserve geometric structure but require dedicated encoders and are difficult to plug into existing architectures. Moreover, external priors can be inaccurate, costly to acquire, or difficult to maintain, motivating a structural representation that can provide geometric guidance while remaining learnable and broadly applicable. We address this limitation with the Lane Field, a dense BEV-aligned geometric representation that encodes local lane structure at each spatial location and can be either predicted from onboard observations or constructed from external map priors. Building on this representation, we introduce a plug-and-play framework that enhances online HD mapping through two complementary mechanisms: BEV feature modulation, which injects lane-structured cues into latent BEV features, and deformable attention guidance, which steers query sampling toward the underlying lane geometry. We primarily evaluate our method on OpenLane-V2, showing that conditioning BEV features and guiding deformable attention with local lane geometry enables our framework to consistently improve existing methods and achieve state-of-the-art performance on lane segment perception.
Overview
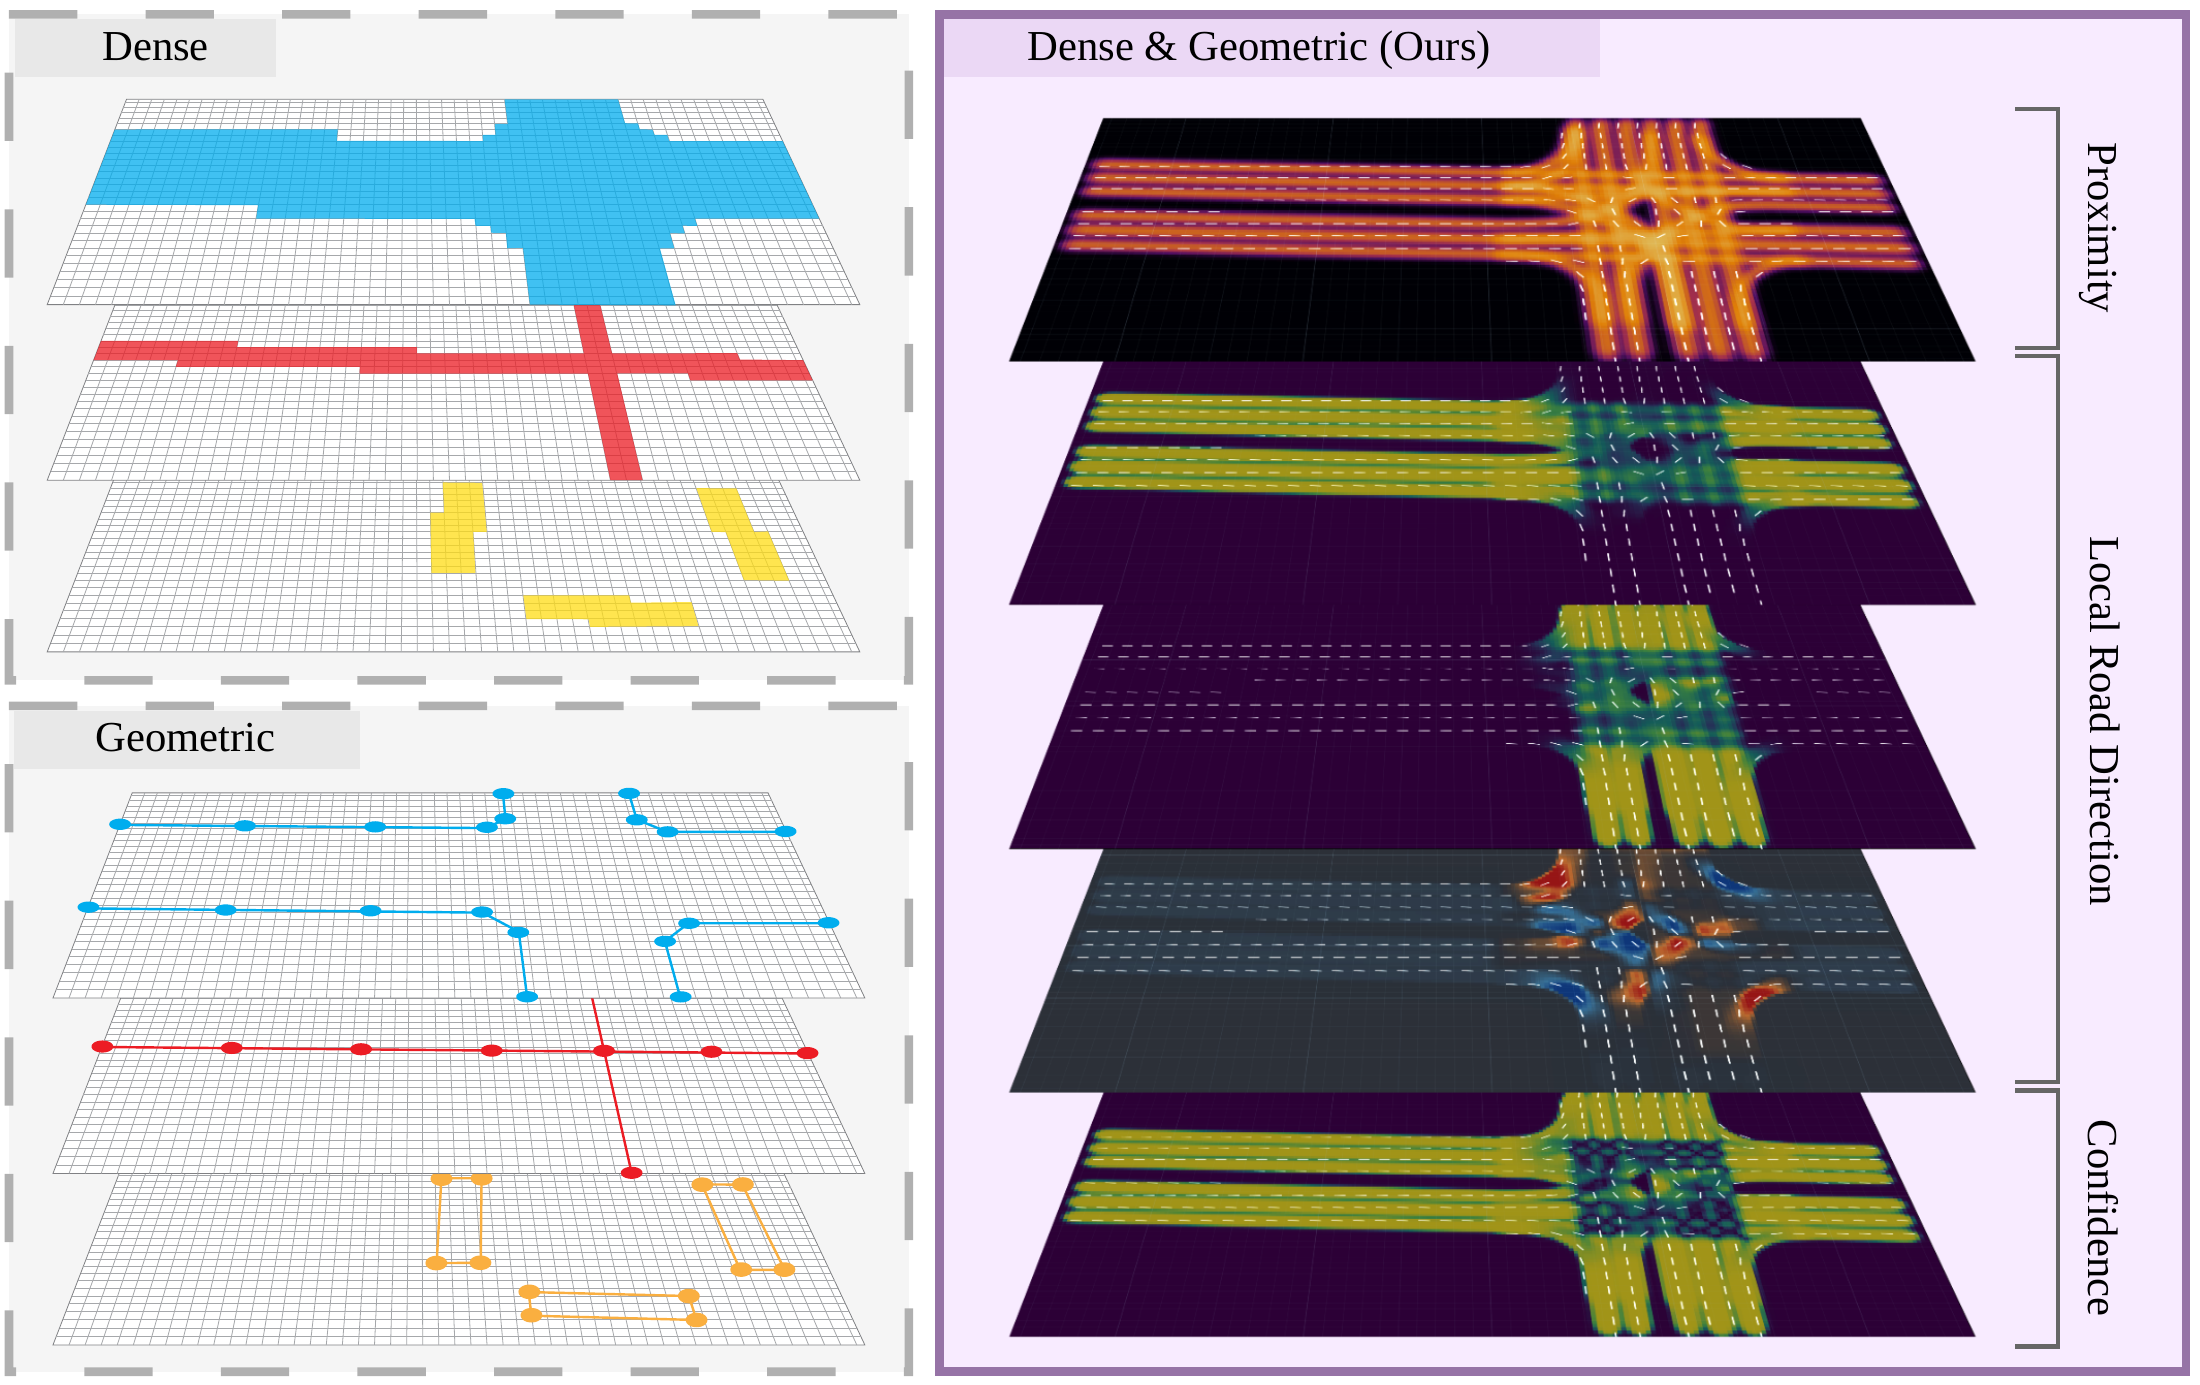
A dense field for proximity, orientation and confidence. Lane Field turns local lane geometry into a conditioning signal for BEV features and deformable attention.
 Enlarge
Method
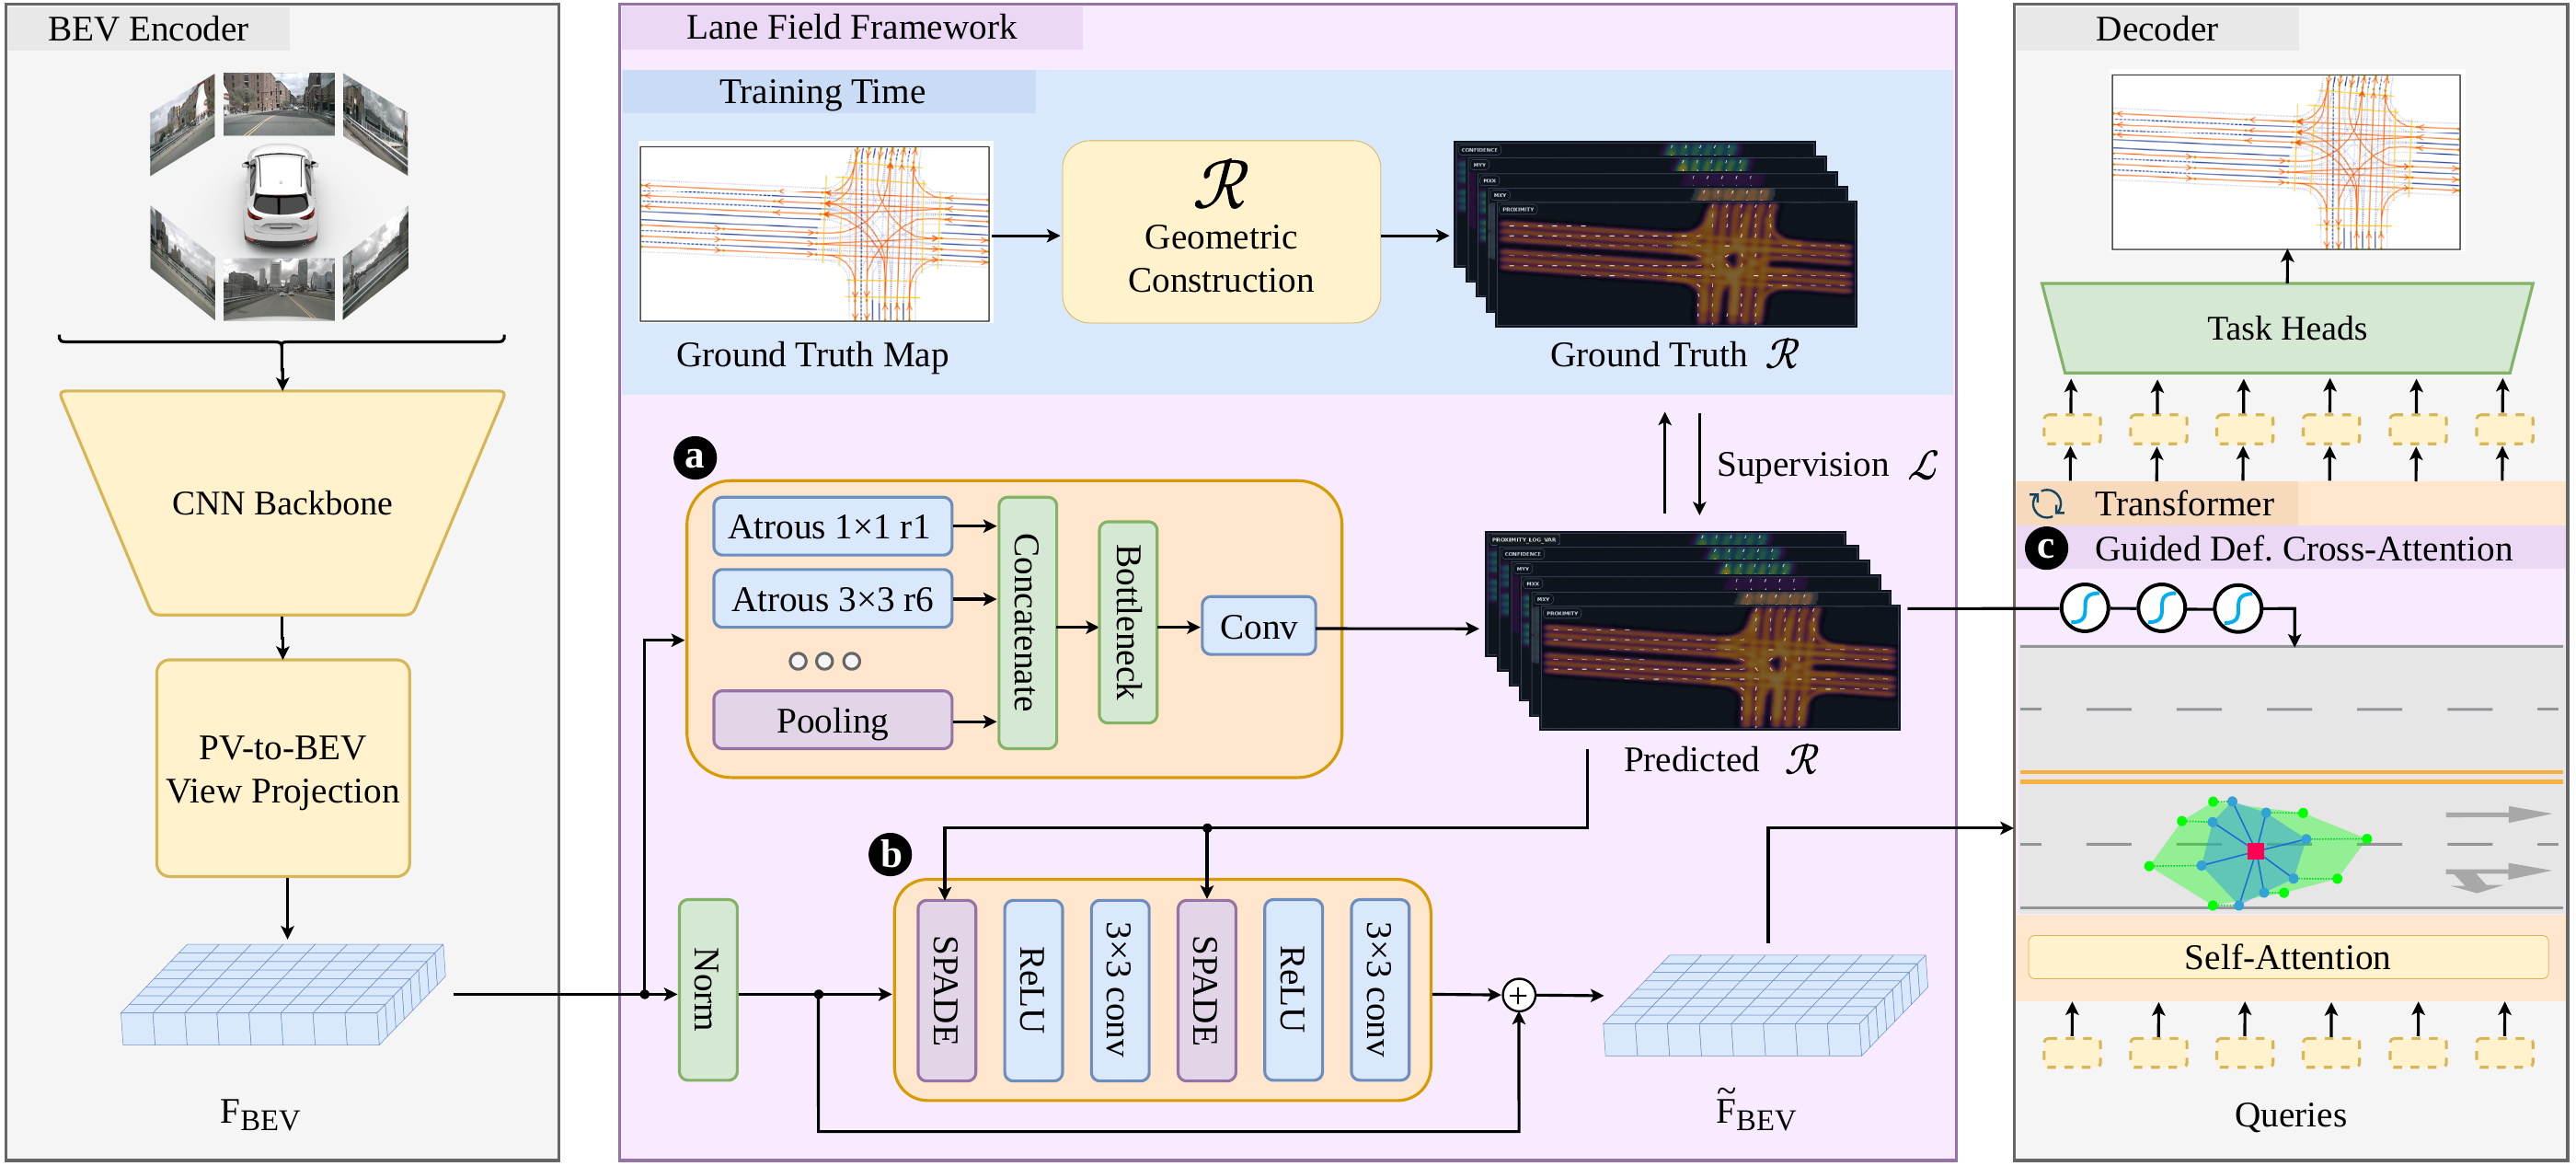
Camera observations → BEV features → Lane Field prediction → feature modulation and guided attention. Vector annotations provide analytic supervision during training; external map priors can supply the same representation.
 Enlarge
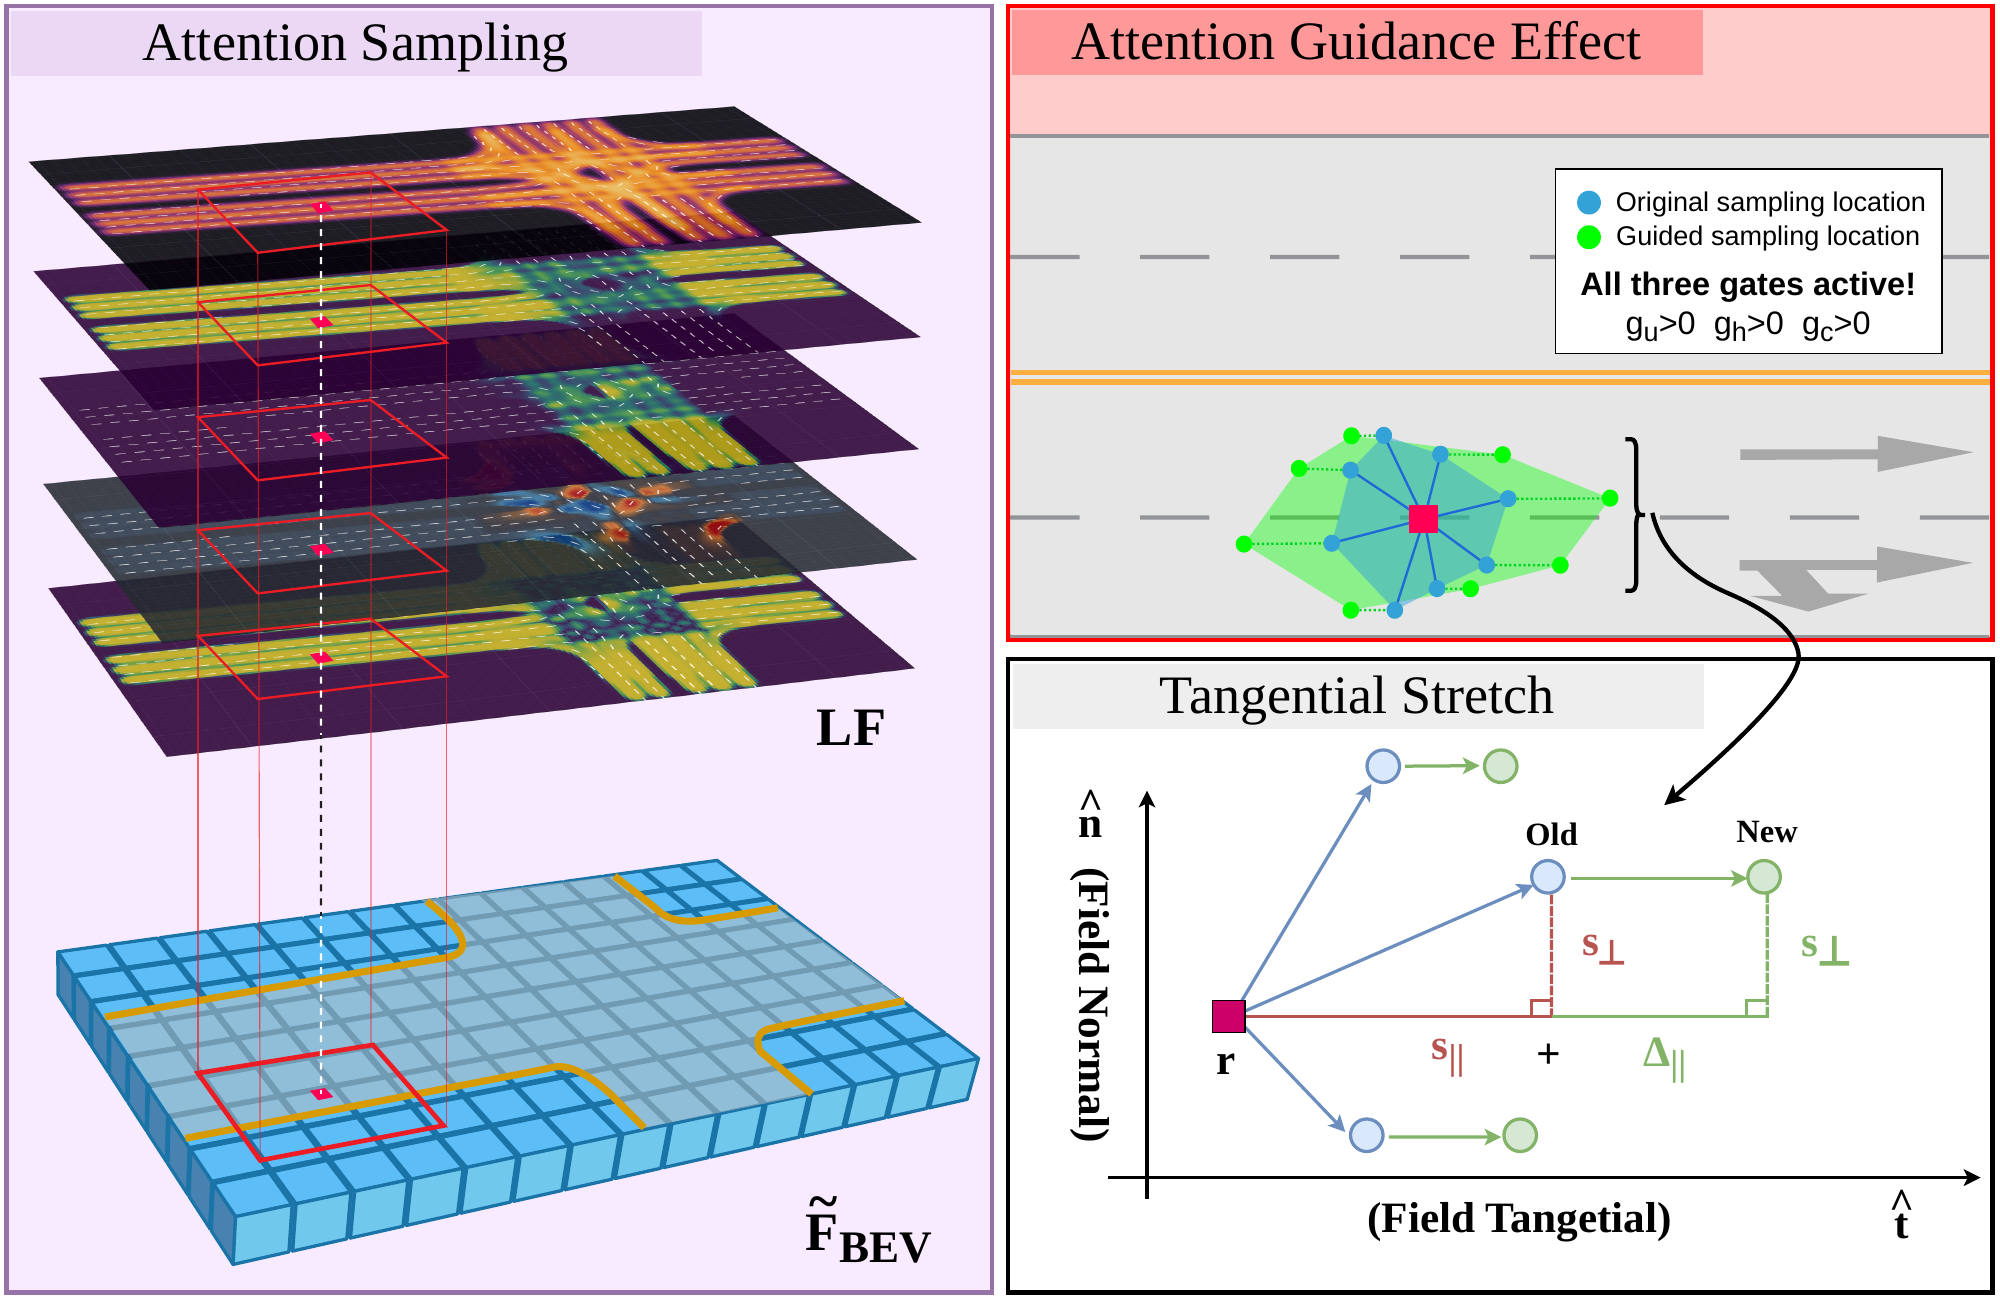
Inside the framework BEV modulation & attention guidance
 Enlarge
 Enlarge
Lane Field prediction
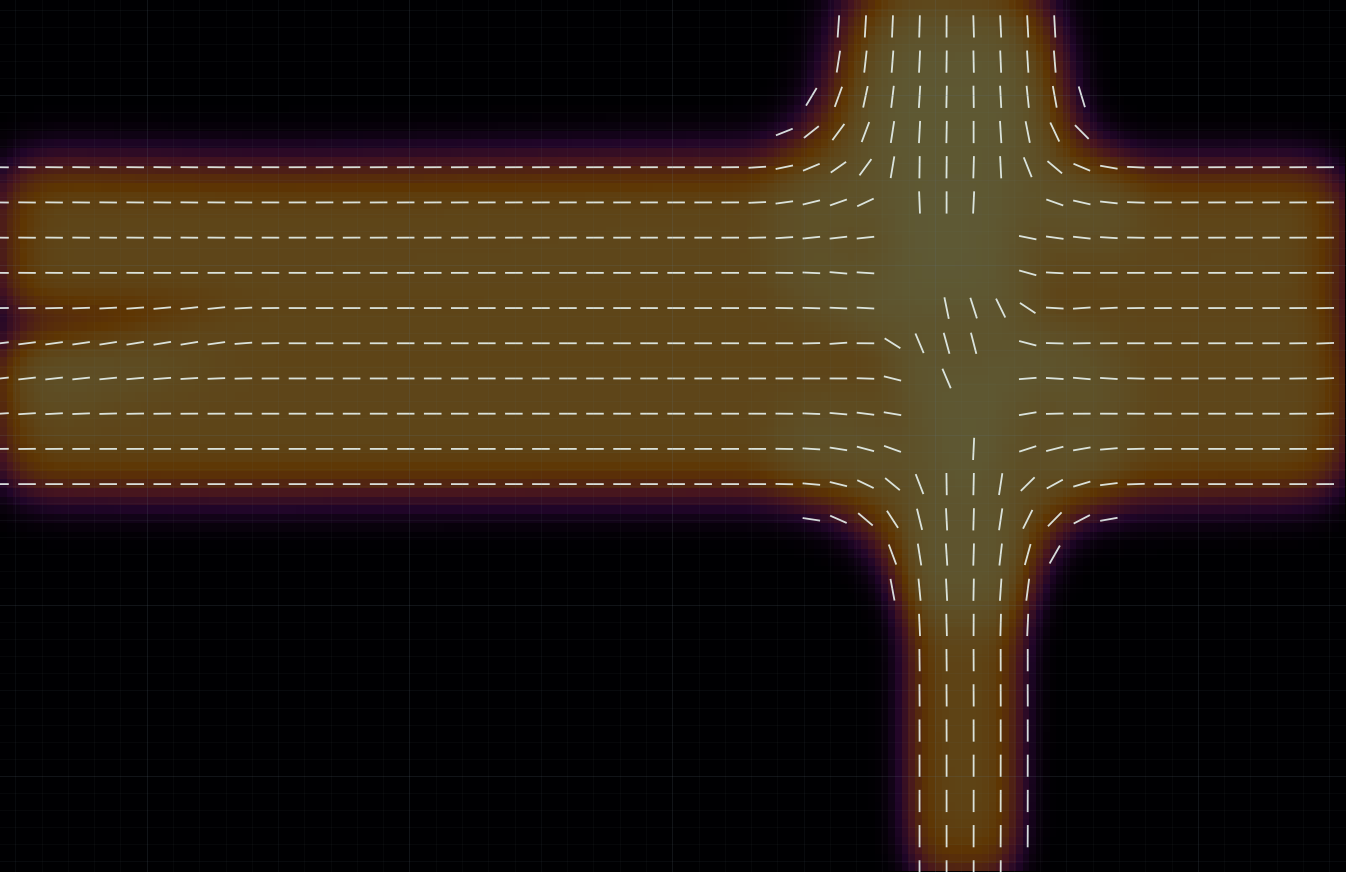
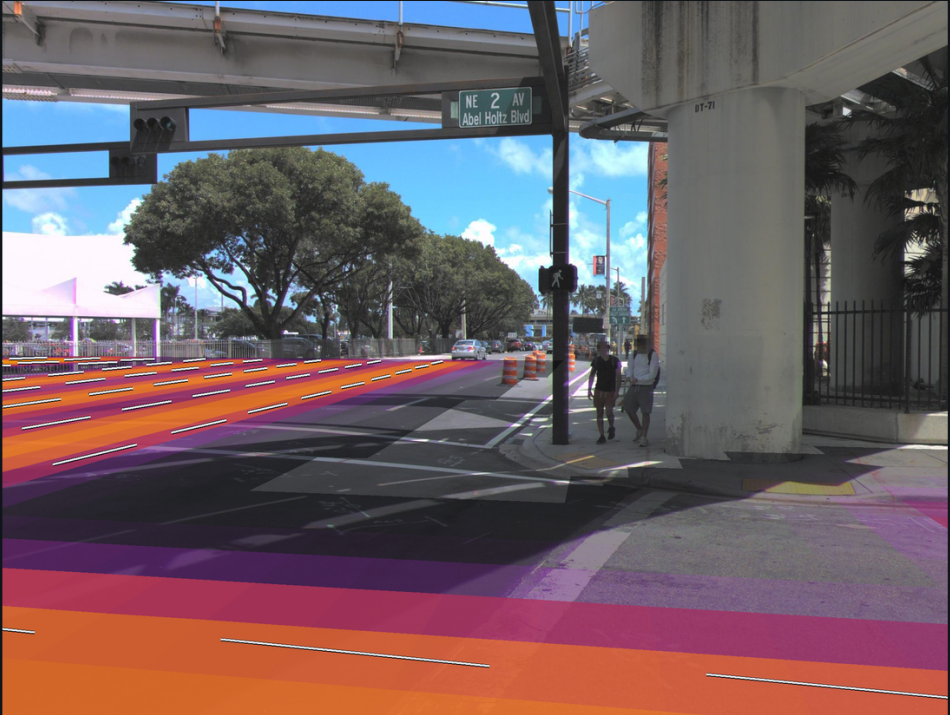
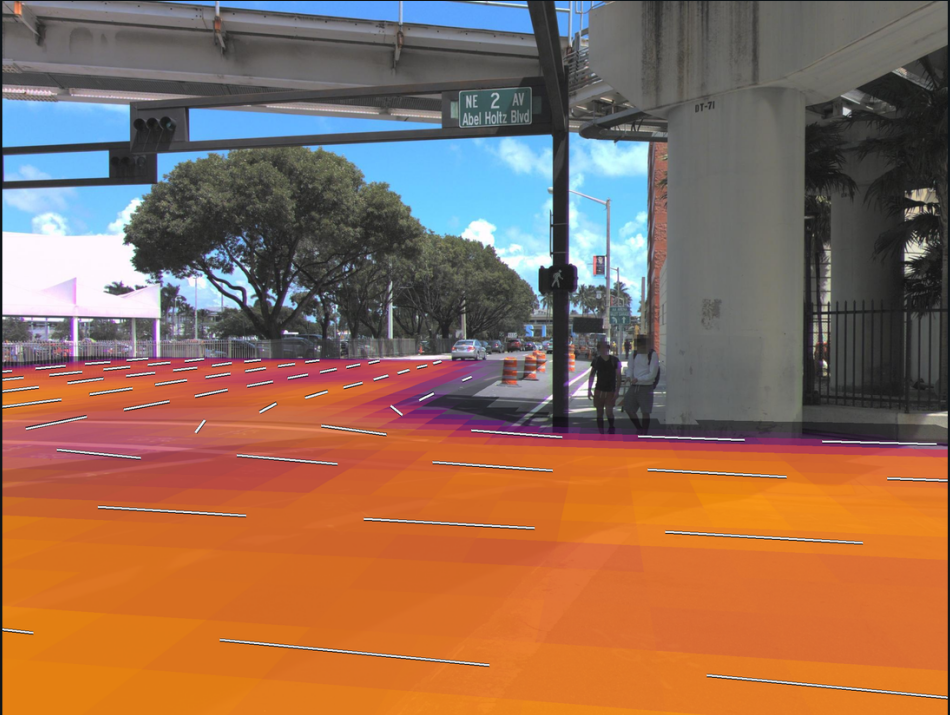
The representation describes proximity, local lane direction, and directional confidence across the BEV grid. The following video shows predicted fields across driving scenes.
Visualizations
Build the representation interactively, then inspect the paper’s maps, attention patterns and uncertainty estimates. Select any research figure to enlarge it.
From lane geometry to a dense field
The Lane Field is constructed analytically from vector map annotations. Each lane segment contributes both a smooth spatial weight and an unoriented direction to every location p in the bird’s-eye-view grid.
Build the field, one point at a time.
Drag p, any segment or its endpoints A and B. In Integrate, drag q(t) too.
Segments & lane boundaries
Start with a centerline.
Split the lane into finite segments. Each has endpoints Ai, Bi and a unit tangent t̂i. The point p is one cell of the BEV grid.
A sparse line becomes a dense signal: every segment will contribute to every grid cell.
Select a segment on the map or above it. Drag its handles or use the angle and length sliders. Shared endpoints keep a bend connected.
Integrate along the whole segment.
Explore S1: move q(t) from A to B. Its Gaussian contribution depends on the distance to p. The shaded area, multiplied by the segment length, gives Ii(p).
The curve follows the selected segment. “In total field” controls whether it contributes to the five outputs below.
Add support. Preserve orientation.
Sum segment weights for proximity P. Weight each tangent’s outer product for the tensor M. Reversing a tangent gives the same tensor.
Select a contribution to inspect its segment. Toggle “In total field” to see what changes when that segment is removed.
Measure agreement between axes.
The eigenvalue gap measures how strongly one axis dominates. Equal orthogonal contributions make M isotropic and confidence approach zero.
Select Crossing, then move p away from its center: one axis gradually takes over.
Illustrative geometry · σ = 1.75 m, lane width = 3.5 m. Outputs use the paper’s analytic integral and supplementary target normalization and proximity mask.
Equations & target normalization Paper §3.2 · Supplementary: derivation & implementation
1. Spread each lane segment over the grid
Split each centerline into straight segments. Segment i has endpoints Ai and Bi, length ℓi, unit tangent t̂i = (Bi − Ai) / ℓi, and average lane width w̄i. Its Gaussian spread is σi = f · w̄i.
Here, t moves from one endpoint to the other. Integrating the Gaussian along the finite segment gives a smooth contribution Ii(p): nearby locations receive more support, and distant locations receive less. The factor f controls how broadly that support spreads.
2. Accumulate direction and proximity
At each grid location, sum the contributions of all segments. Weighting each tangent’s outer product produces a symmetric 2 × 2 directional tensor M; summing the weights alone gives the proximity P.
The outer product is unchanged when a tangent is reversed, so the tensor describes a lane’s axis rather than its travel direction. Proximity measures how strongly nearby lane geometry supports that location.
3. Measure directional agreement
Let λ1 ≥ λ2 be the eigenvalues of M(p). Their relative difference defines the direction confidence C: it is high when a single axis dominates and lower when competing orientations contribute, as at an intersection.
The resulting representation has five channels at each BEV location: three tensor entries, proximity, and directional confidence.
The demo evaluates the closed-form integral from the supplement: Ii(p) = σi√(π/2) exp(−d⊥,i² / 2σi²) [erf(u1,i) − erf(u0,i)], where ai = (p − Ai)⊤t̂i, u0,i = −ai / (√2 σi) and u1,i = (ℓi − ai) / (√2 σi). The projection onto the supporting line is not clamped; the integration bounds account for finite endpoints.
For training targets, Pgt = P / (P + 1) and m = sigmoid(20(Pgt − 0.3)). The output tensor is Mgt = M / (tr(M) + ε) · m, and Cgt = C · m. The five live outputs above use these transformations; the matrix and eigenvalue readouts show the raw accumulations. The implementation also uses a minimum Gaussian spread and numerical stabilization. These constructed fields supervise the prediction head and can also encode external map priors.
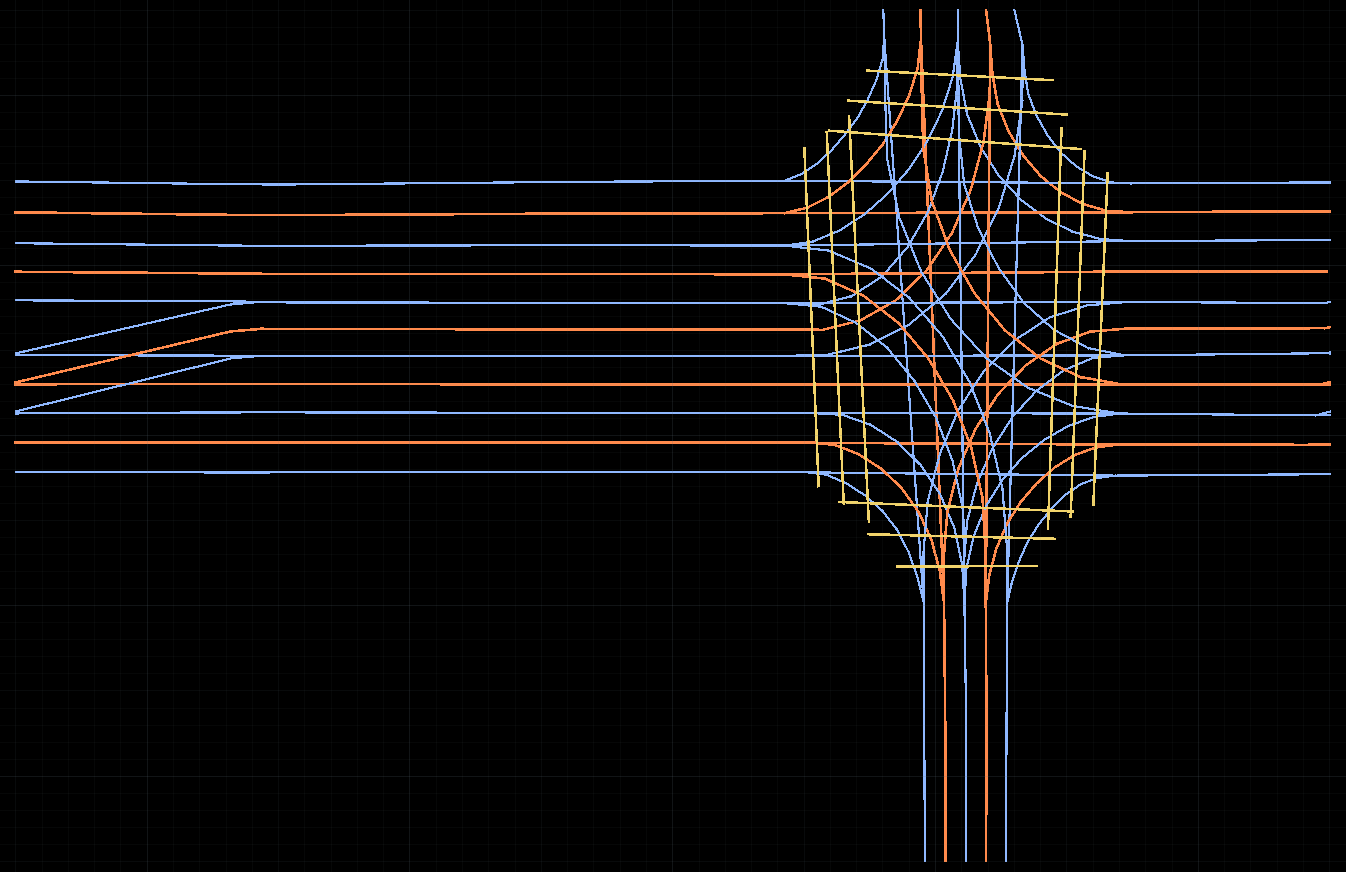
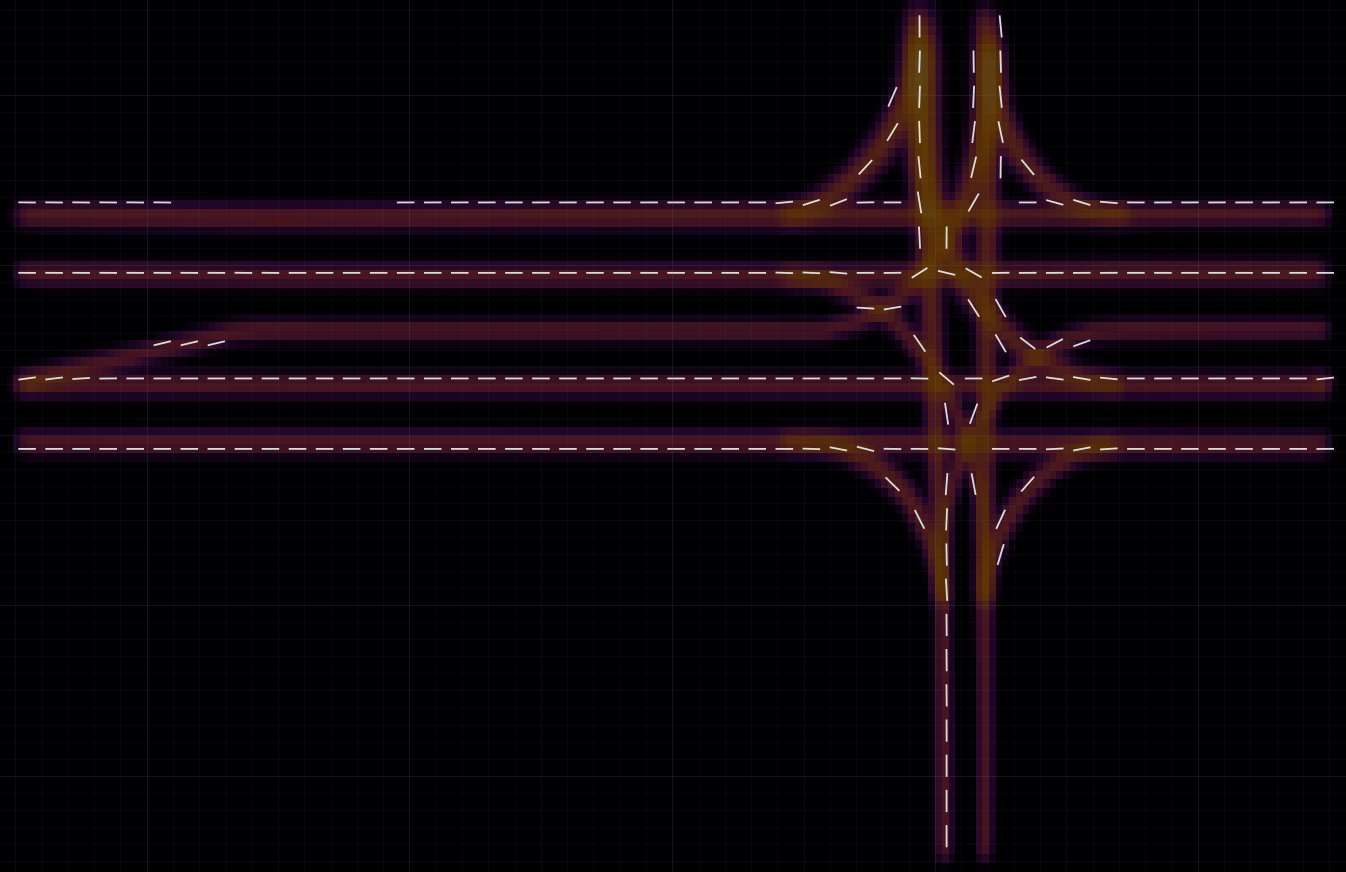
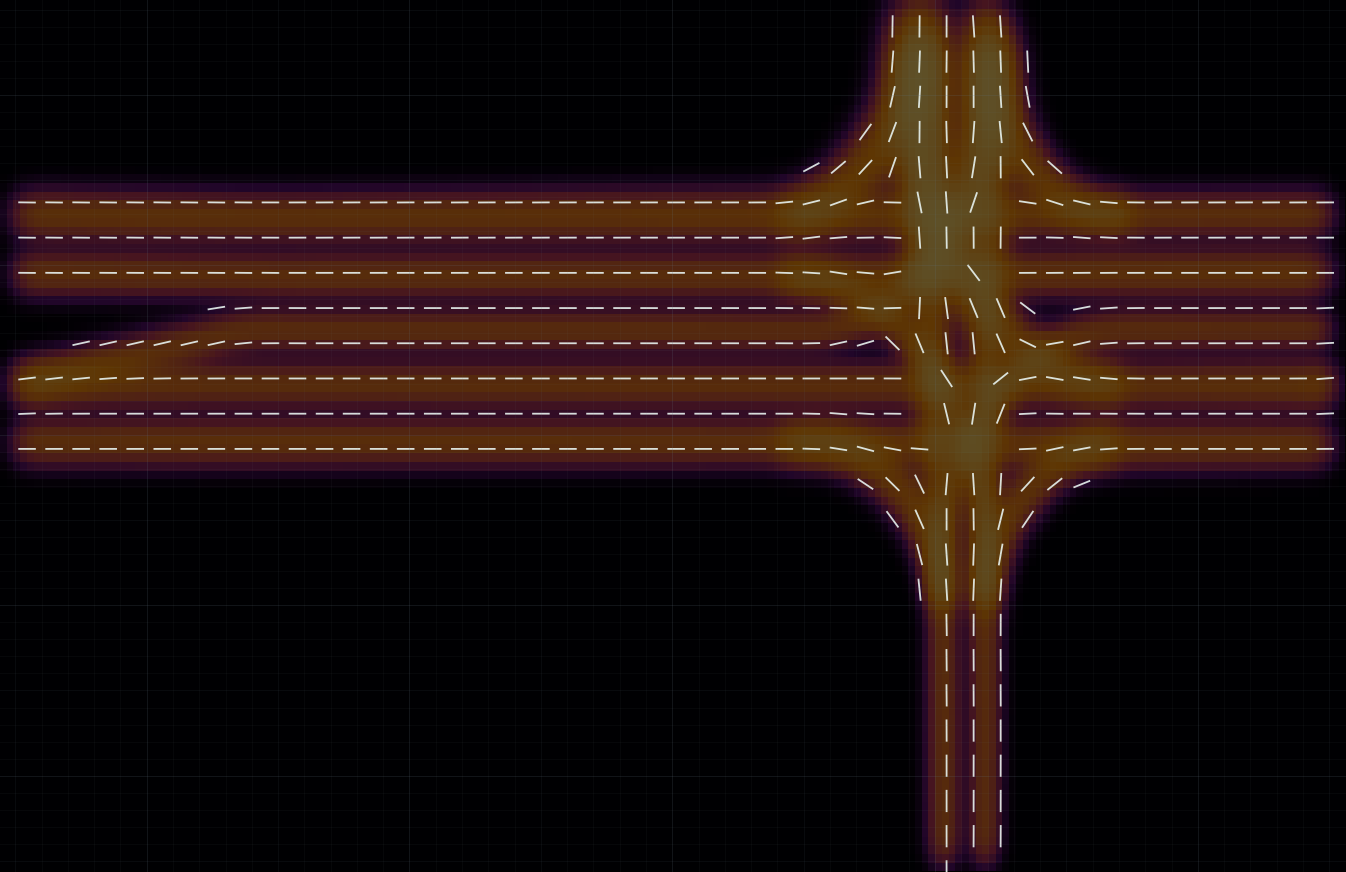
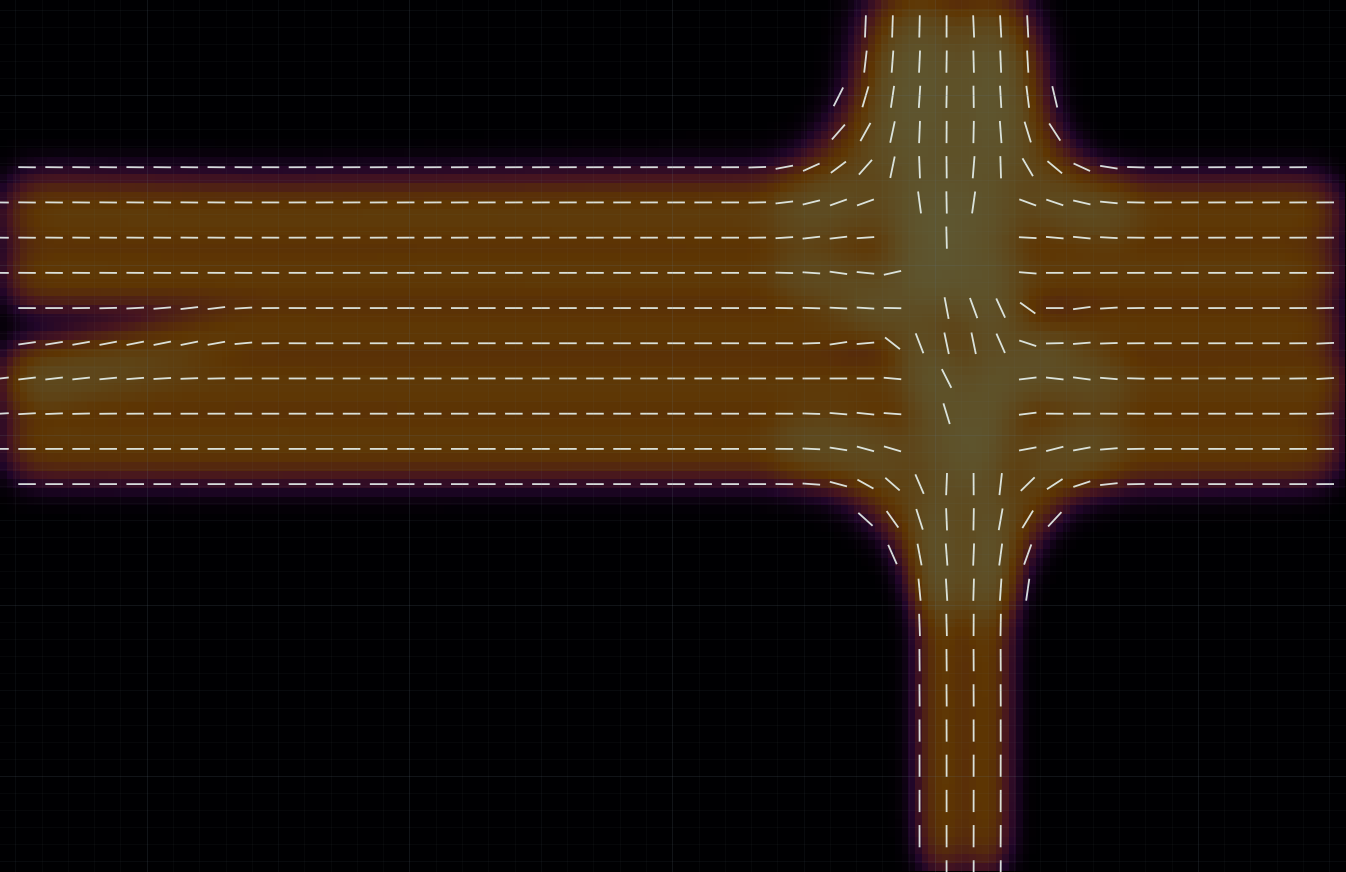
How wide should the field spread?
The demo keeps σ fixed. In the paper, σi = f · w̄i adapts it to lane width. Compare the actual ground-truth fields below: increasing f broadens support. The paper uses f = 0.50.
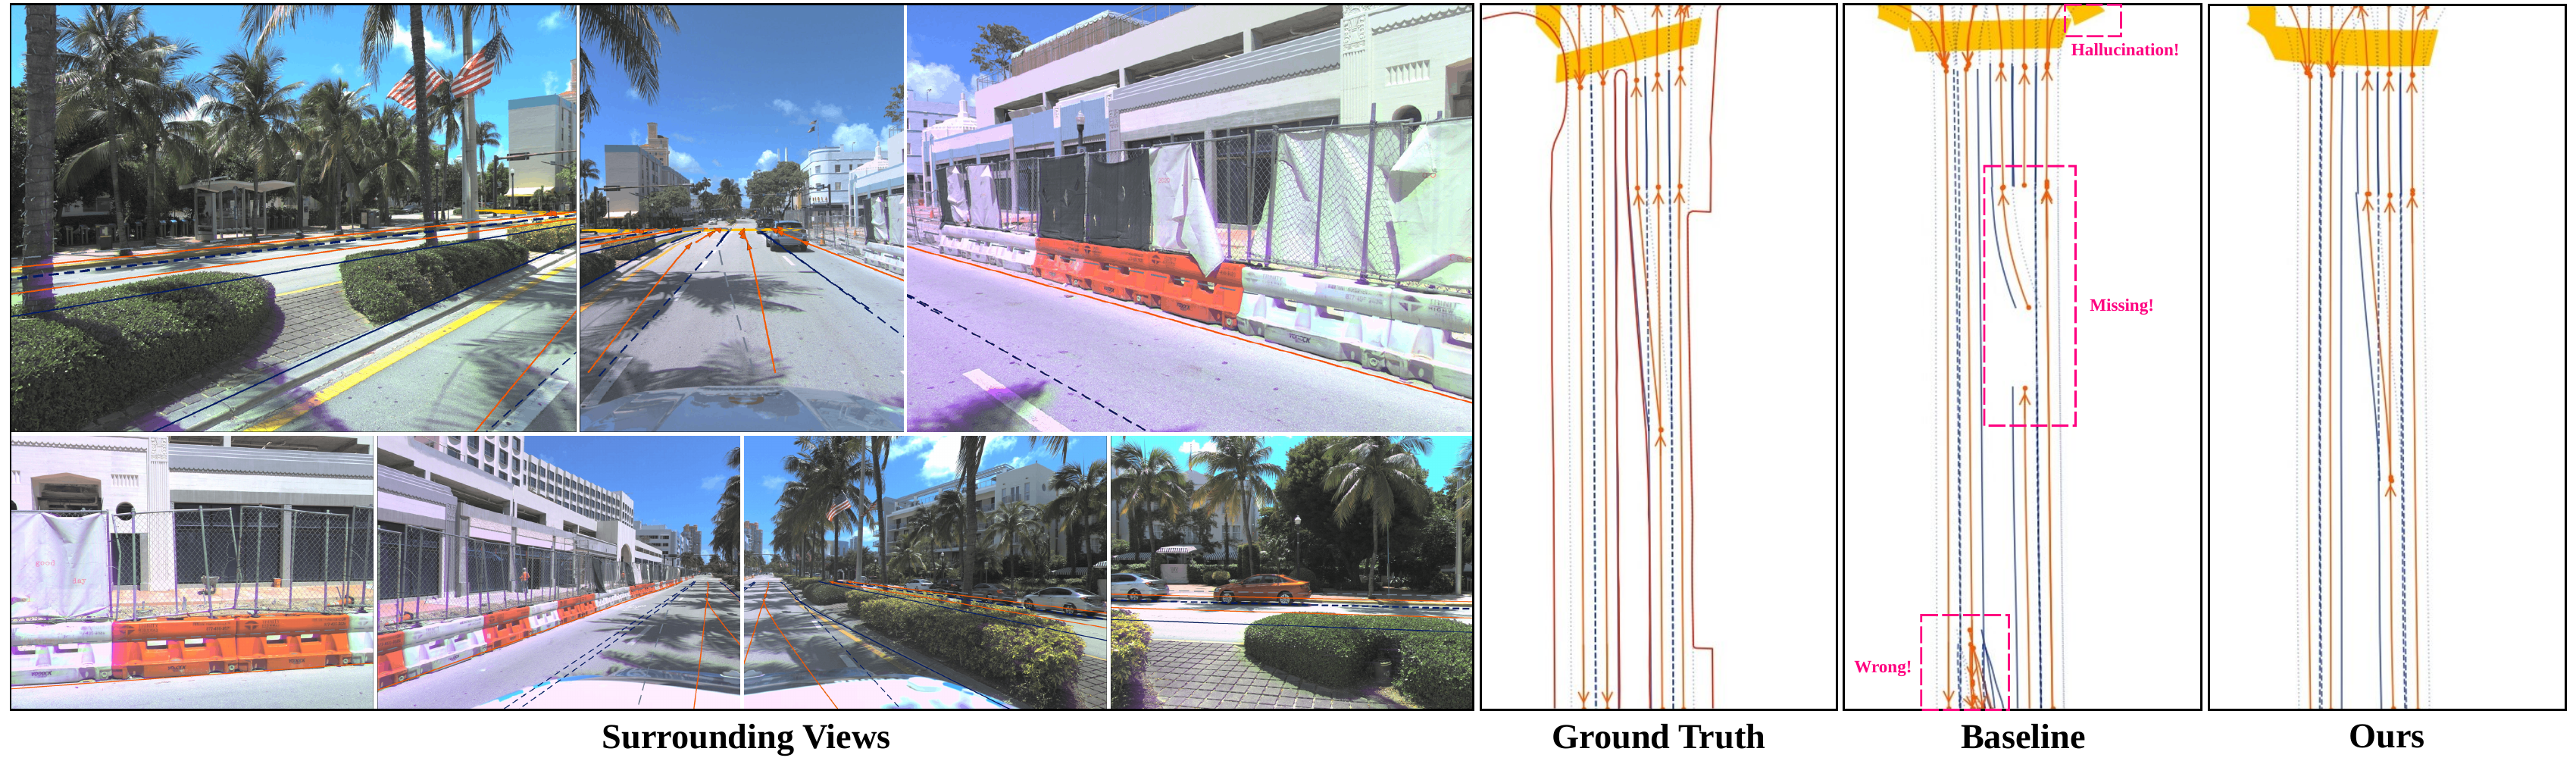
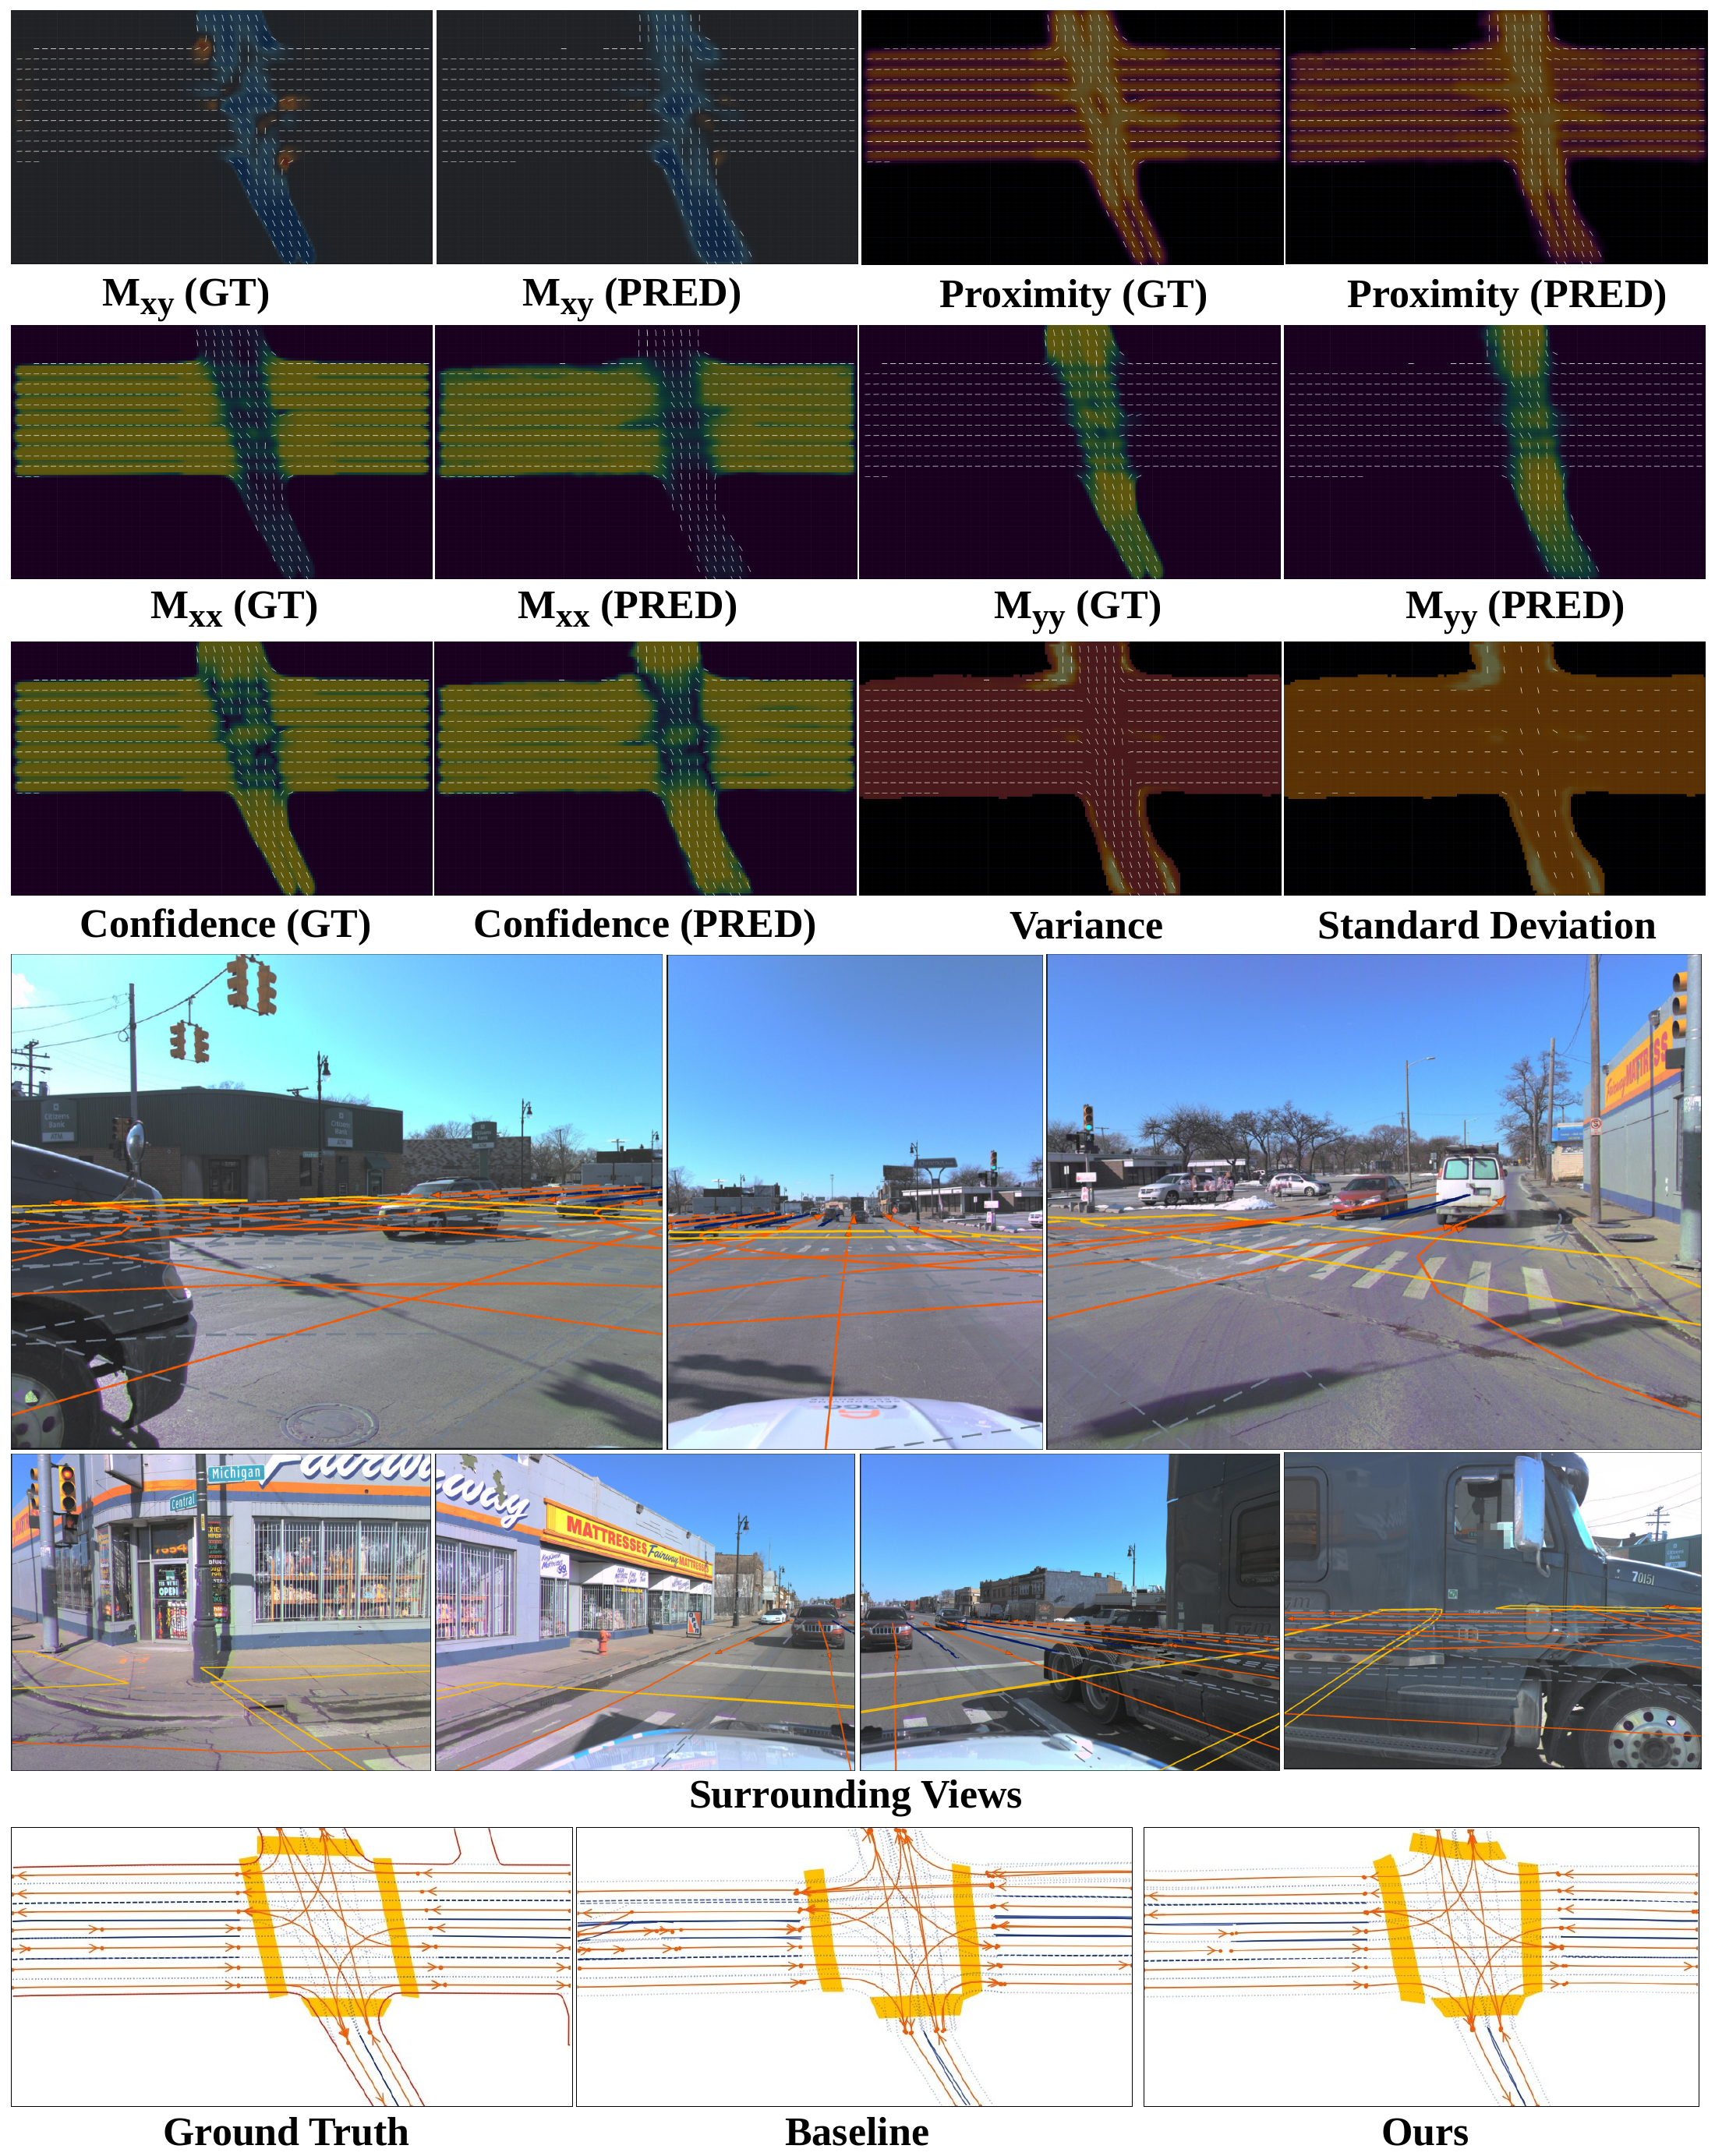
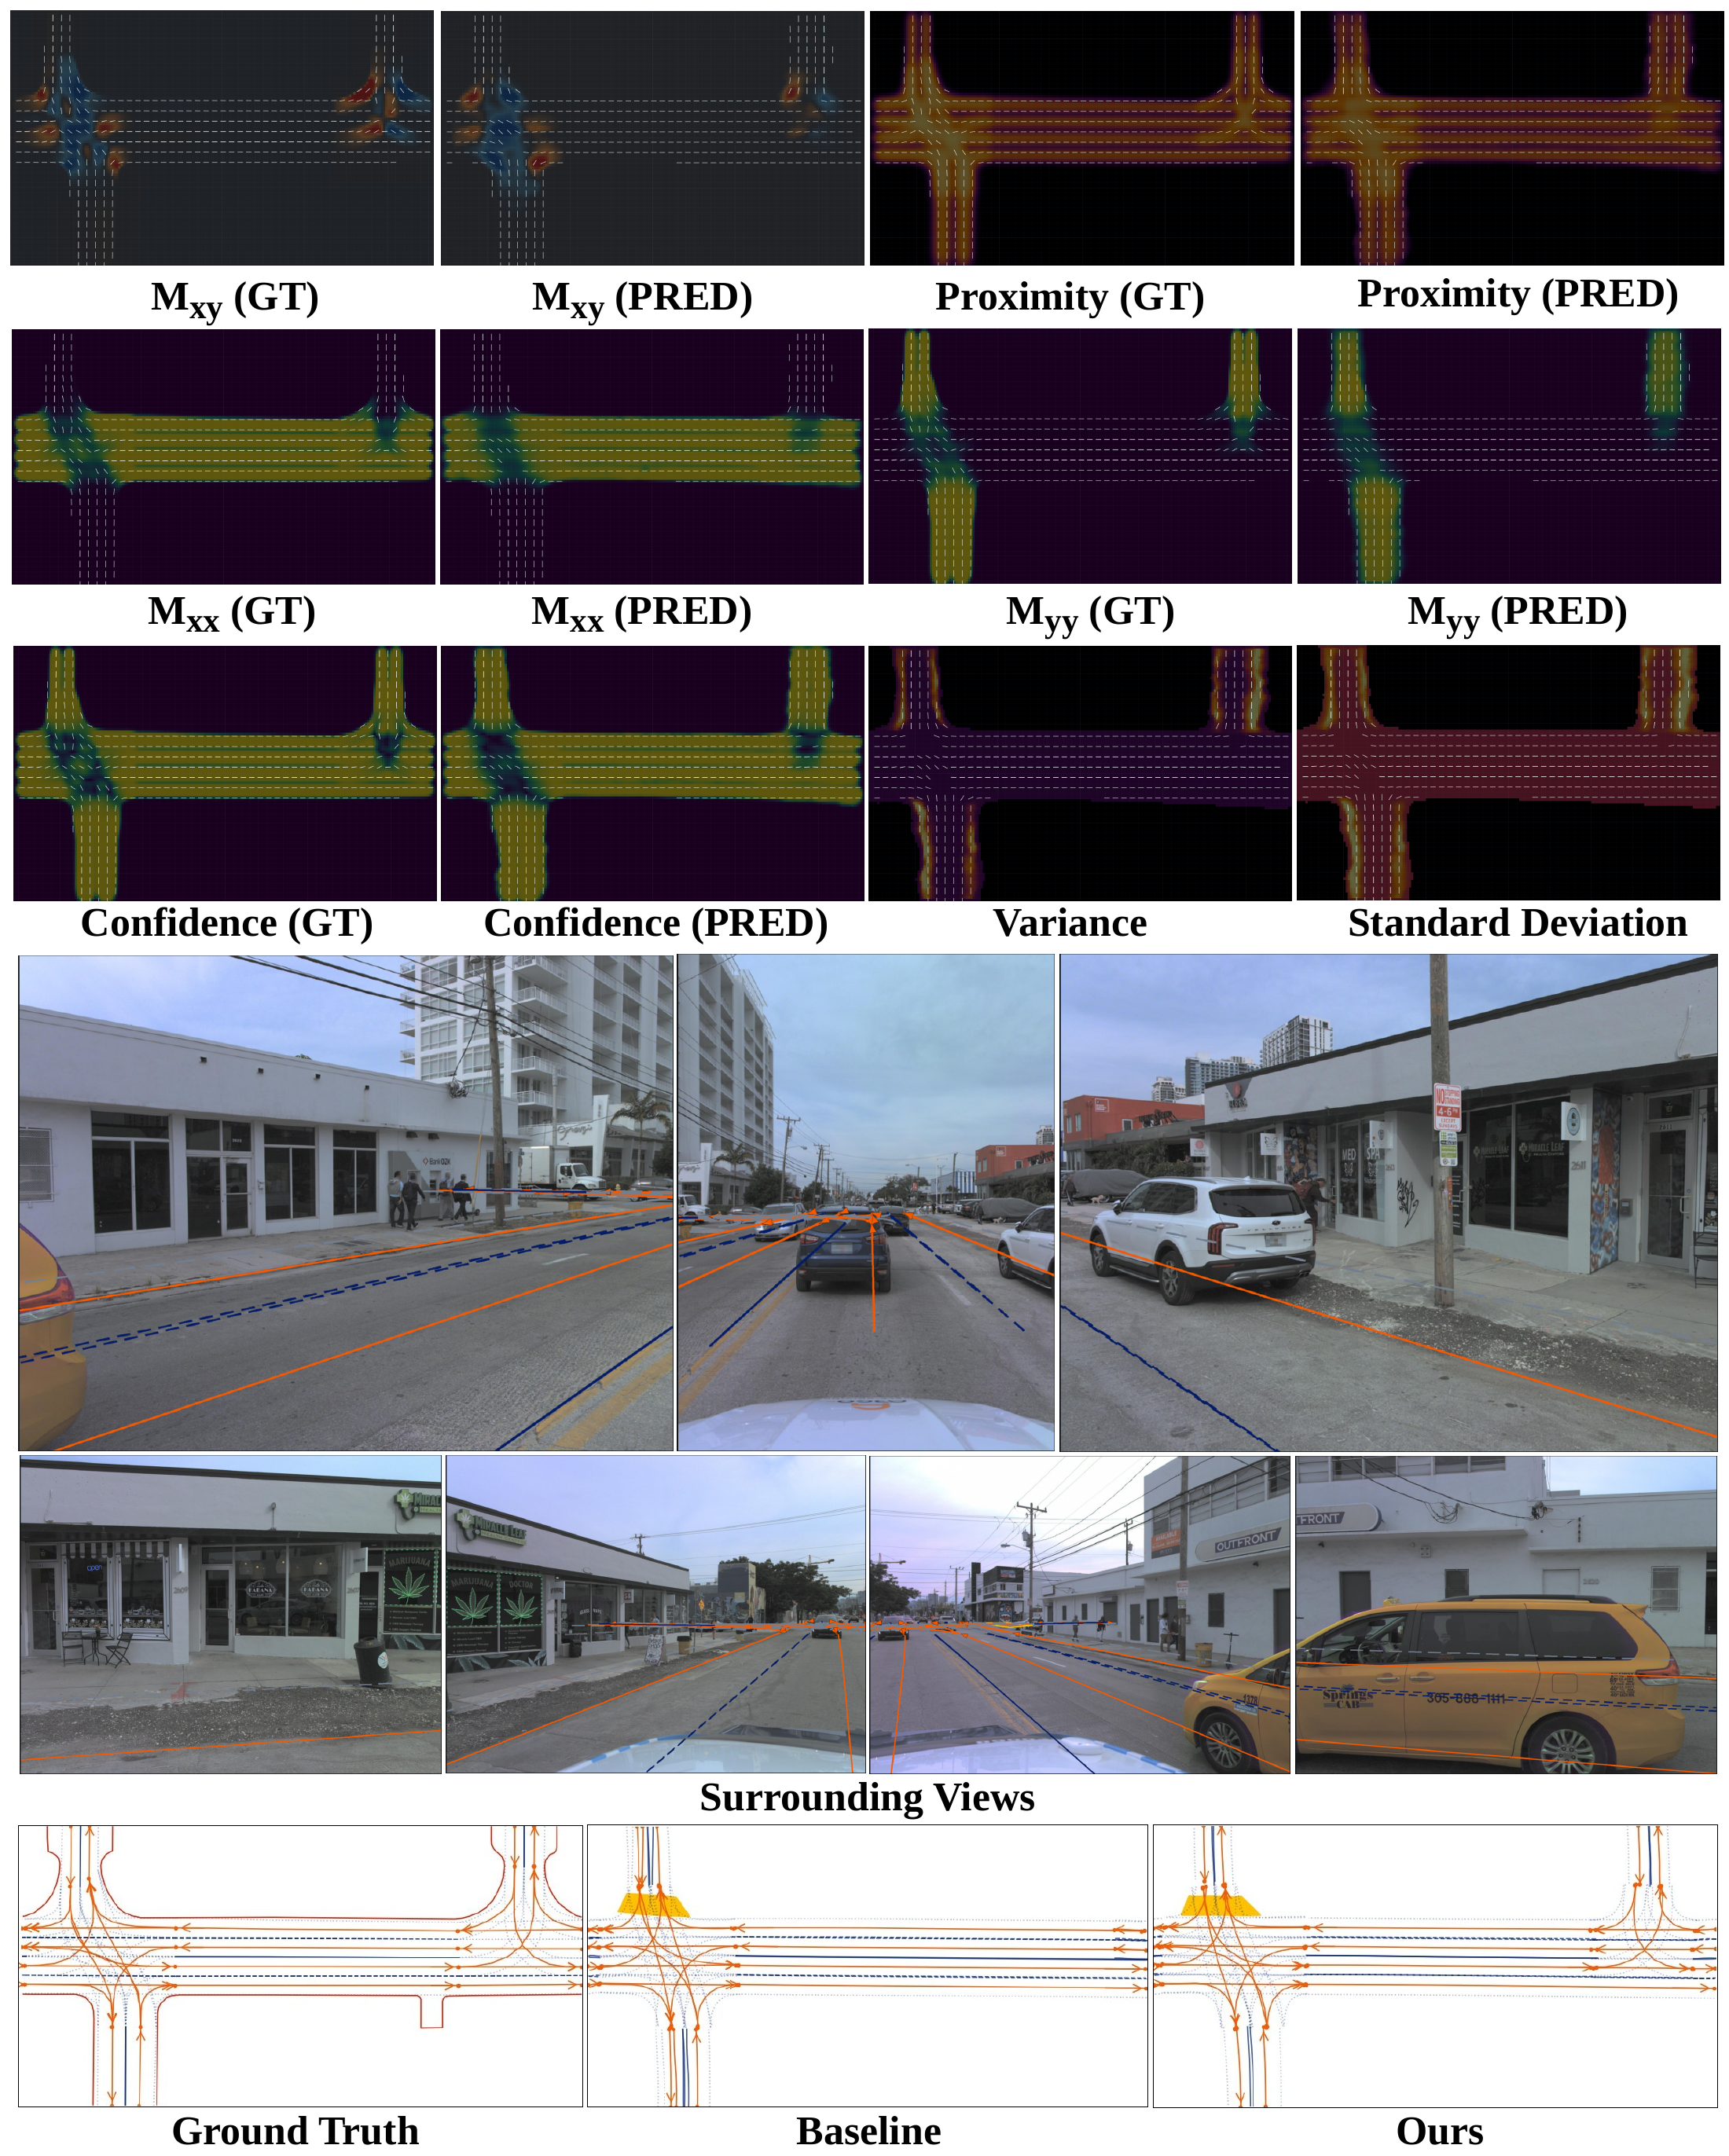
Qualitative map predictions
 Enlarge
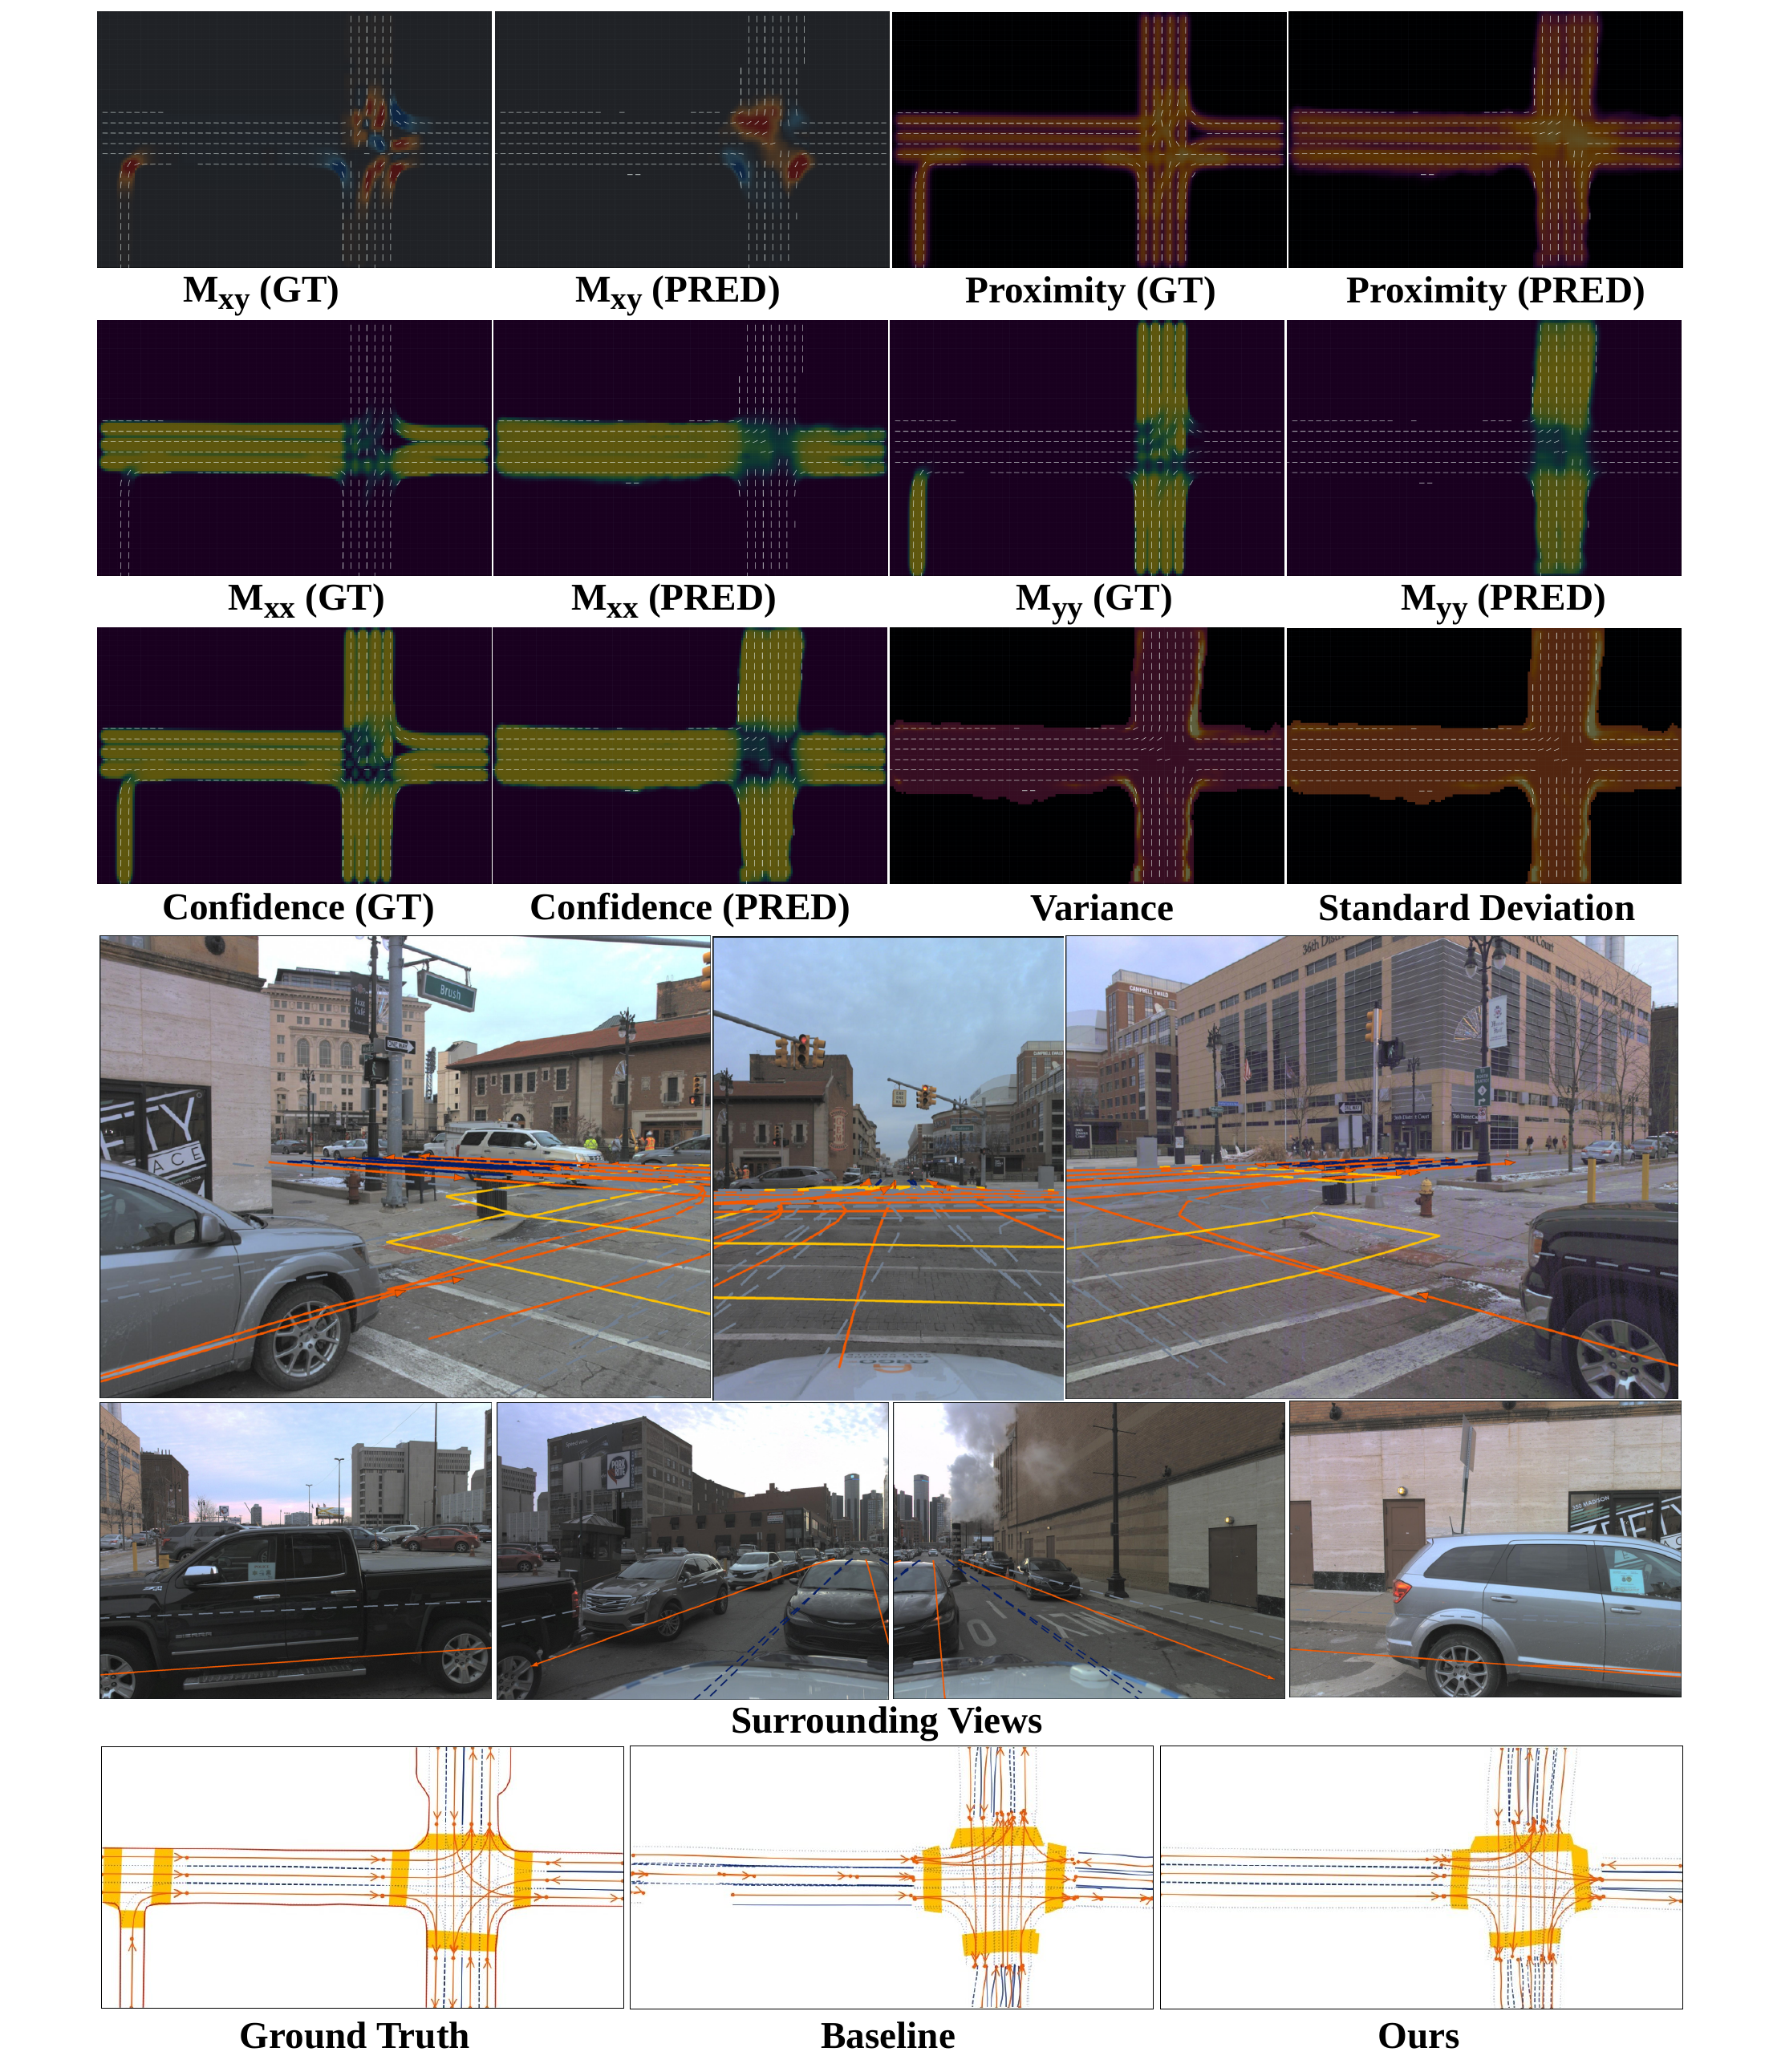
More scenes: pedestrian crossings and distant intersections
 Enlarge
 Enlarge
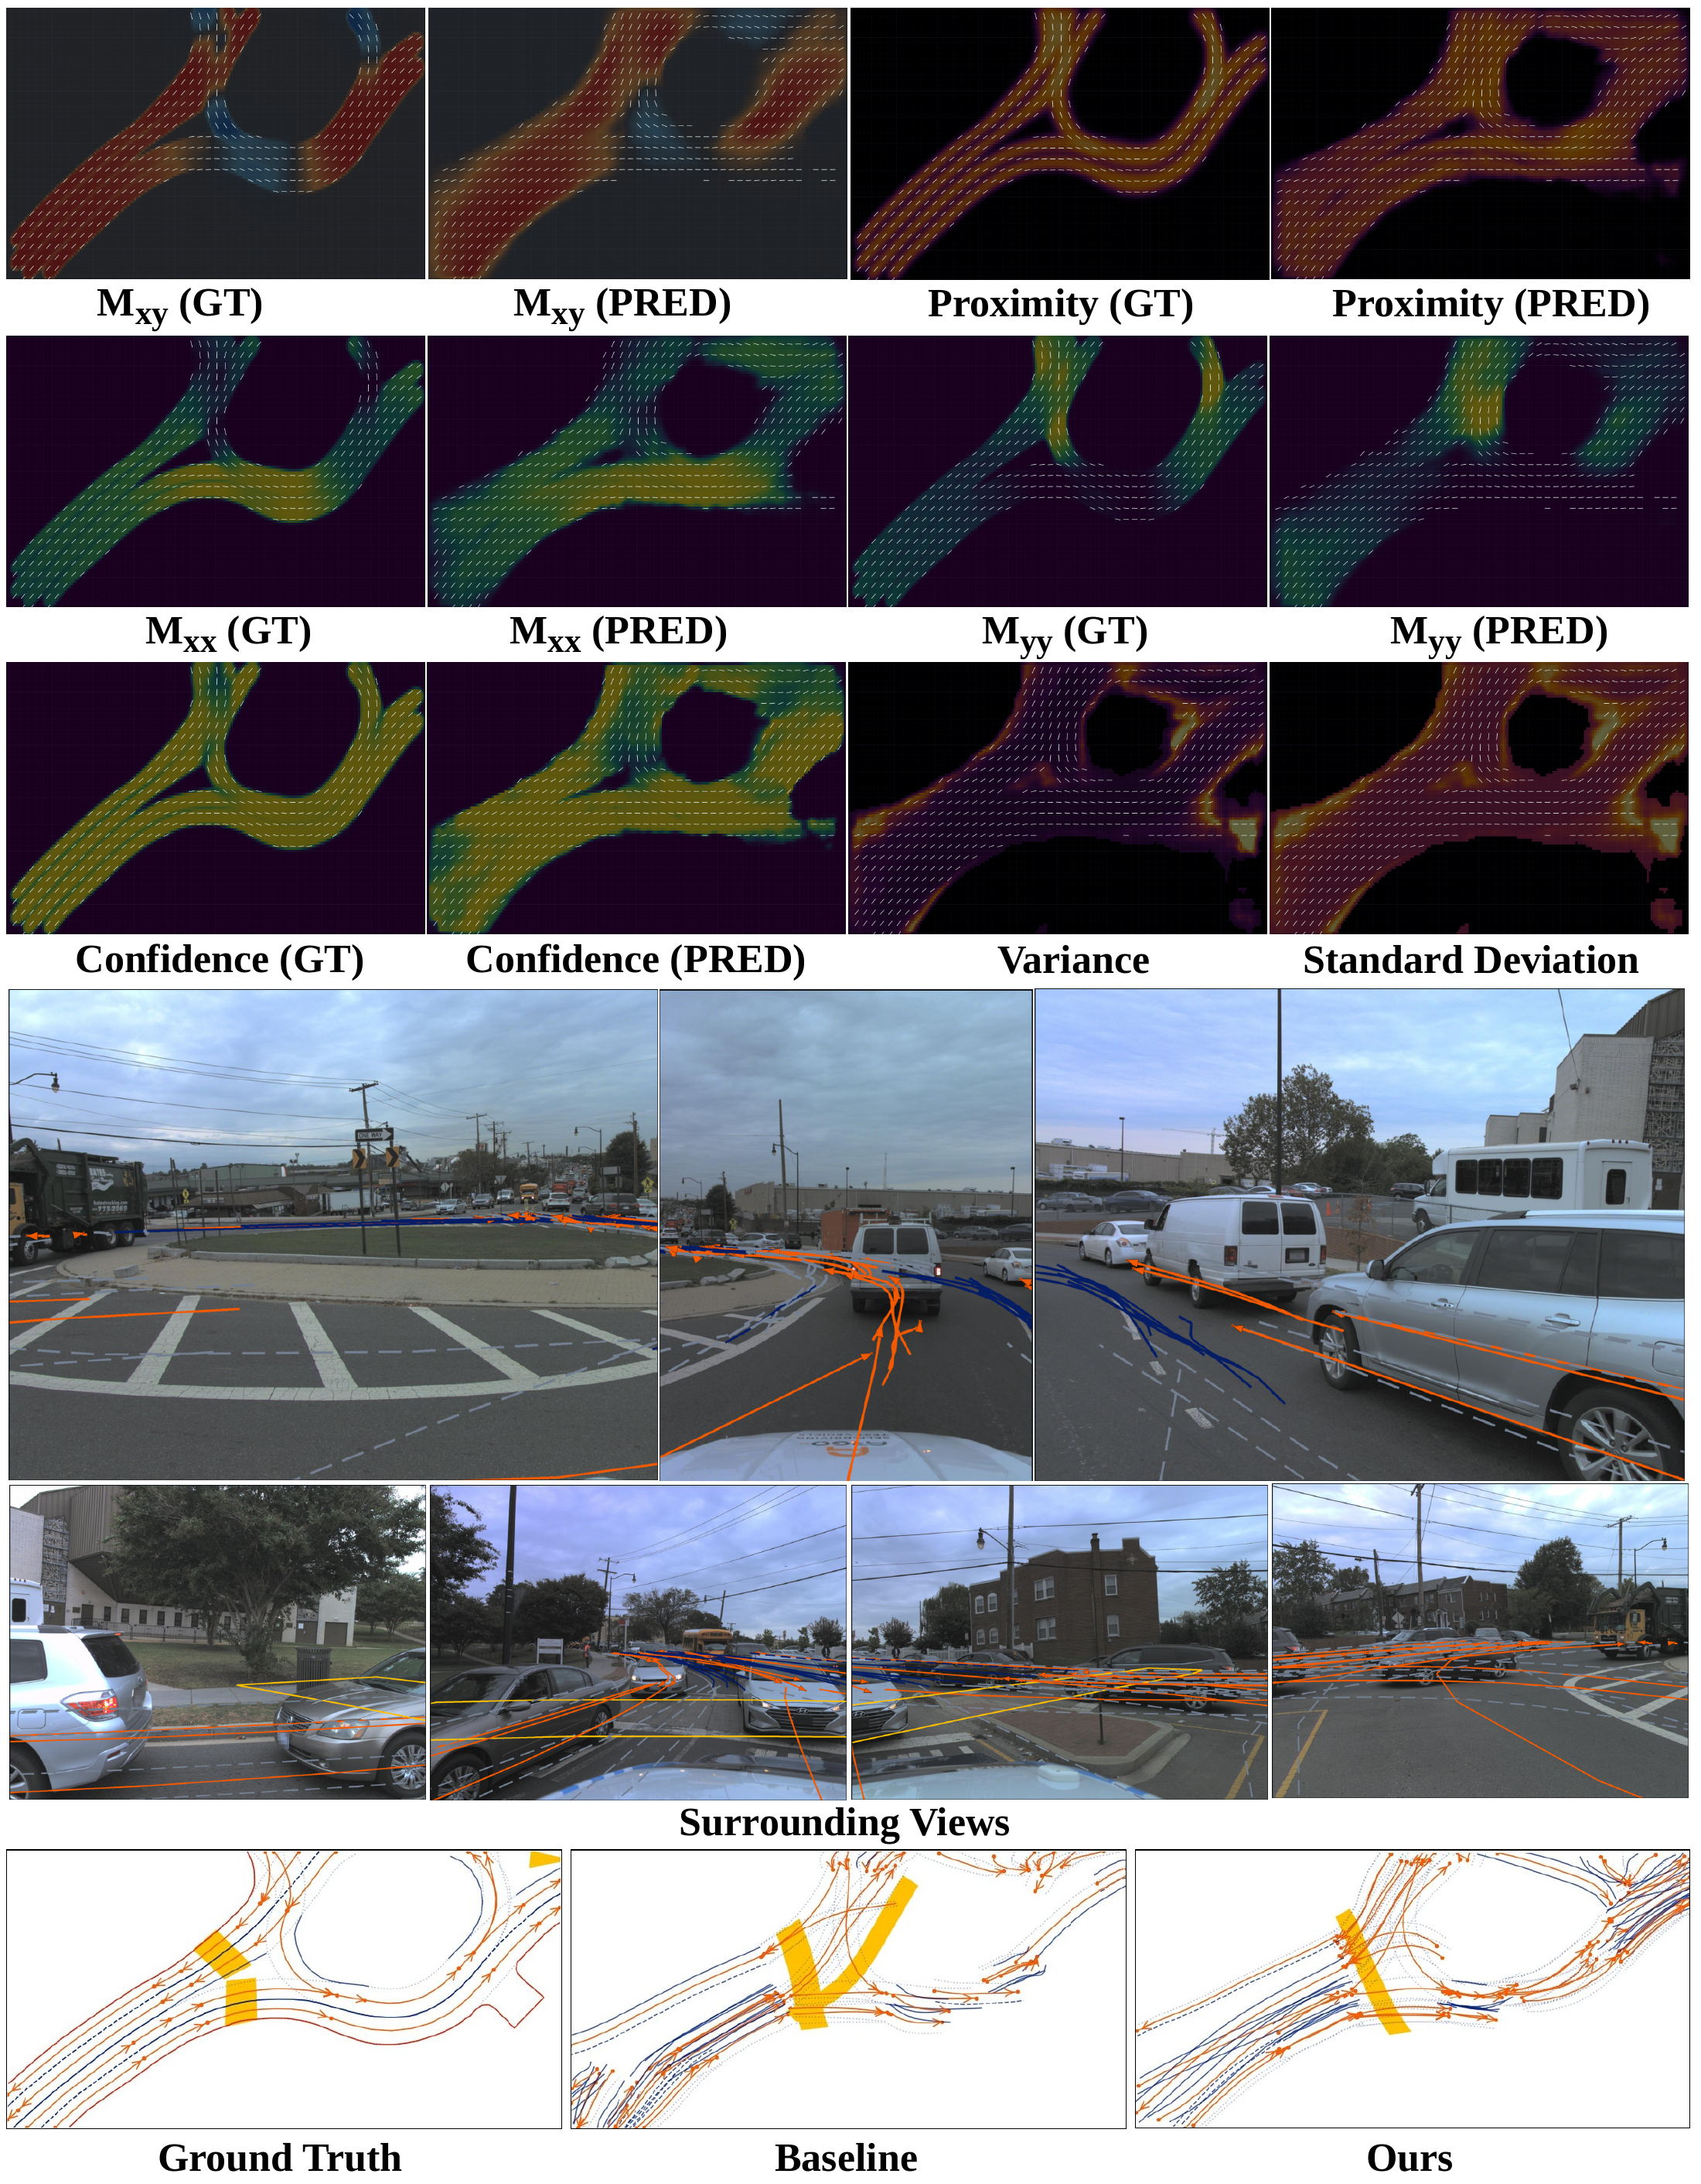
Failure cases: roundabouts and missed crossings
 Enlarge
 Enlarge
Where the decoder samples
Compare the learned sampling offsets with the Lane Field guided offsets in the last decoder layer. Guidance stretches the pattern along reliable lane directions and is suppressed where the direction is ambiguous or the prediction is uncertain.
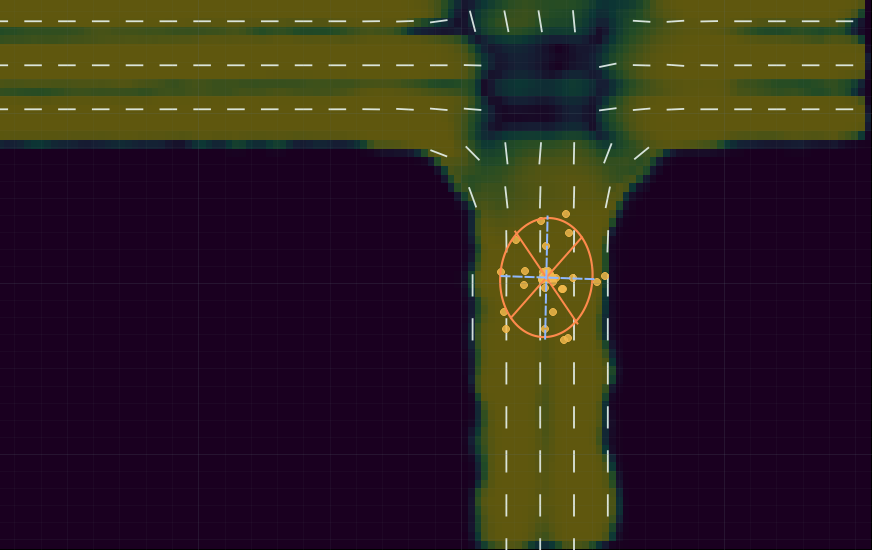
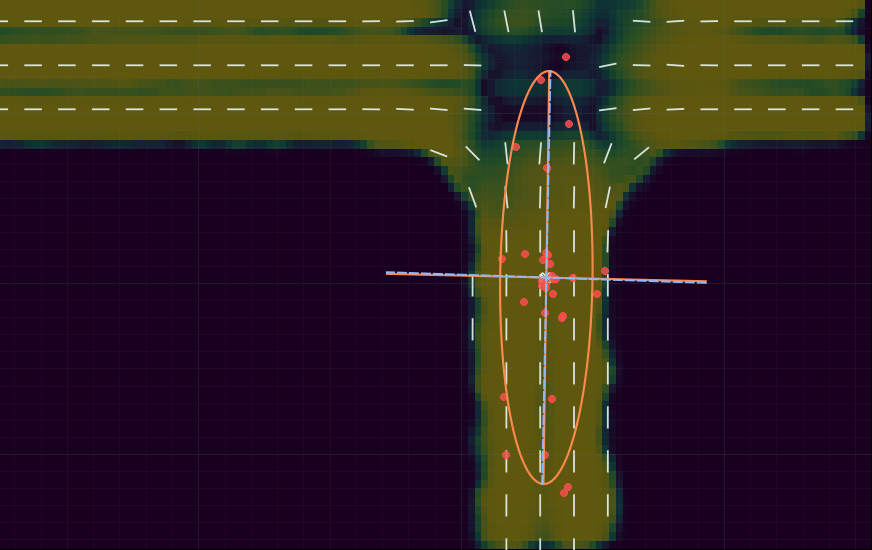
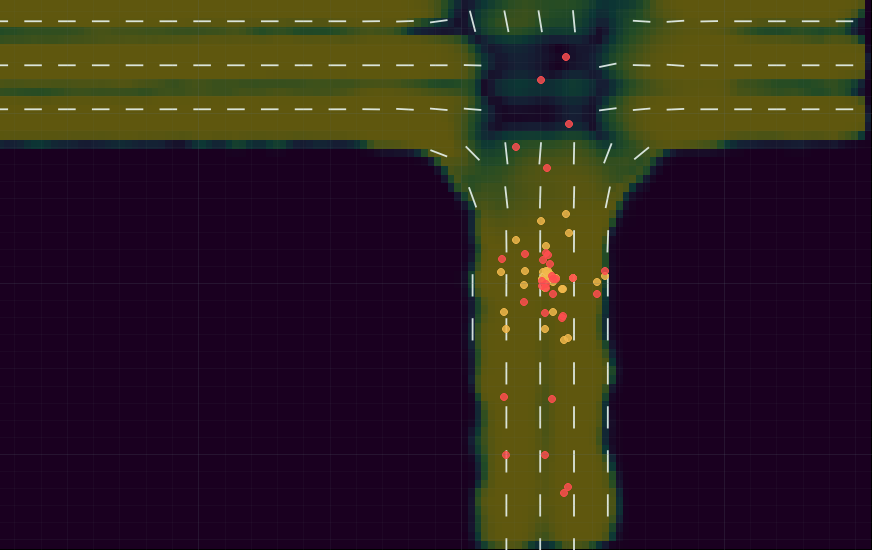
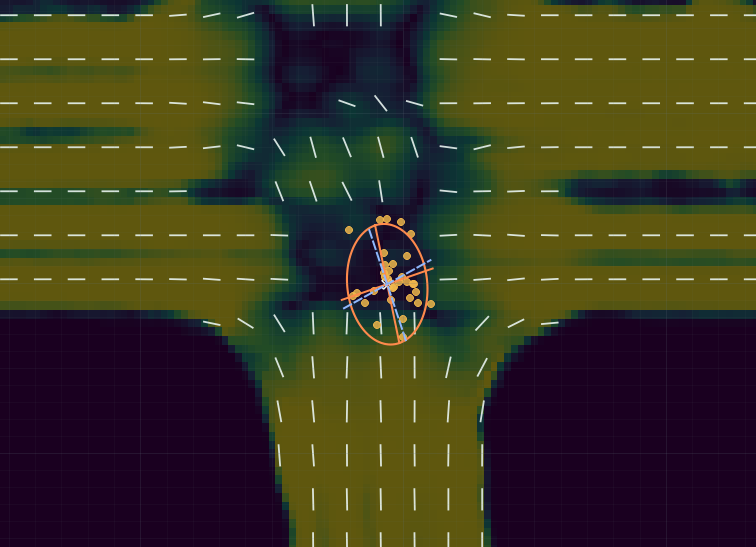
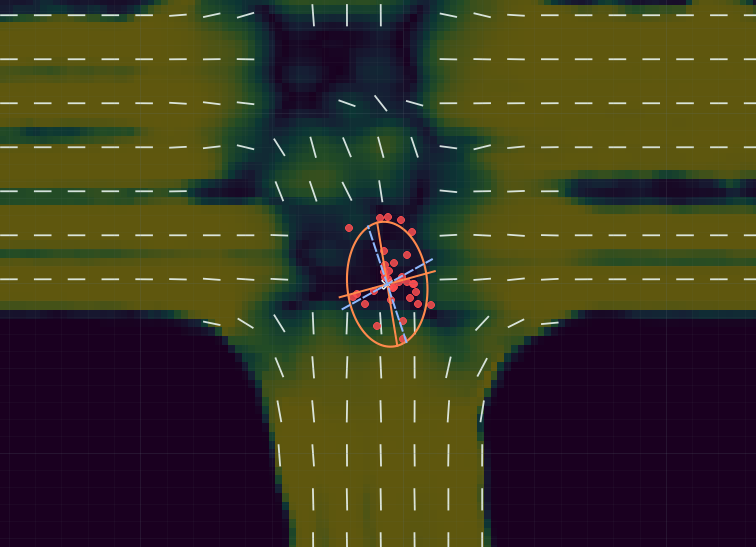
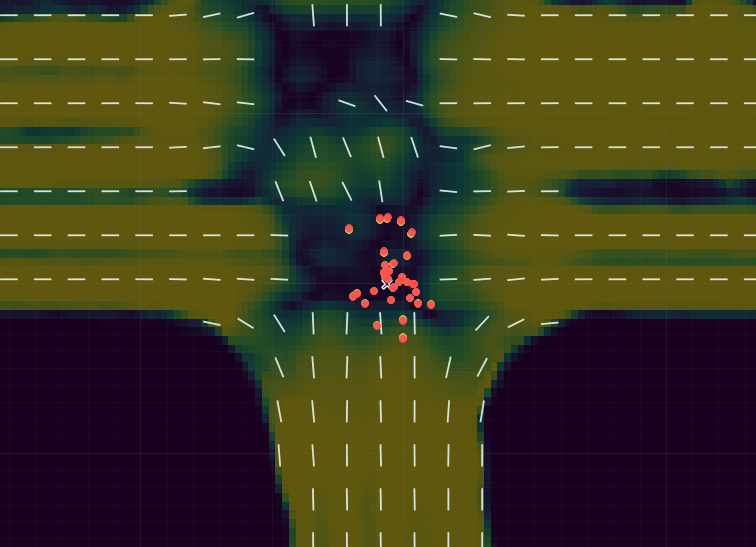
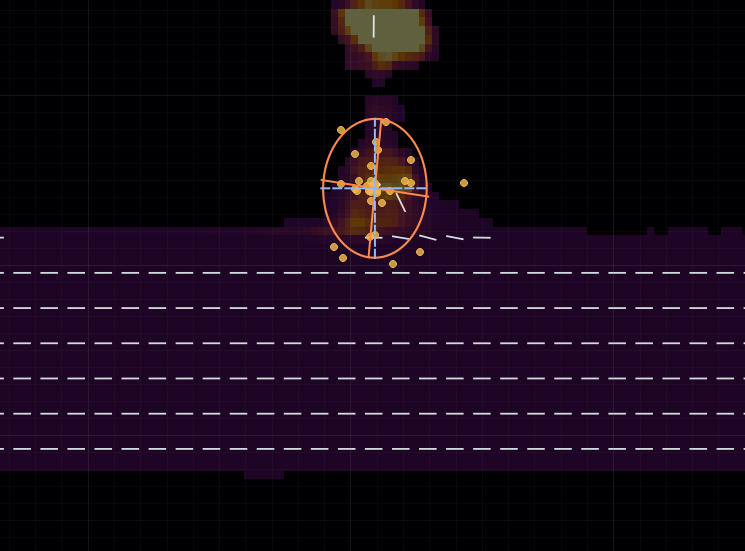
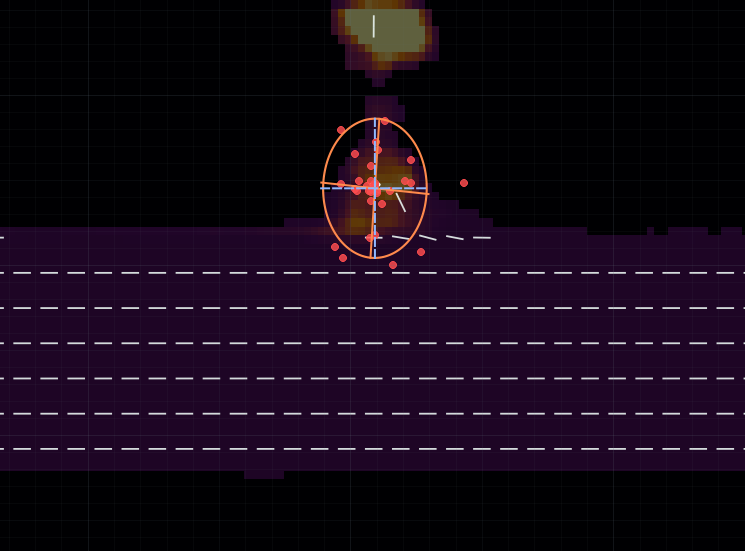
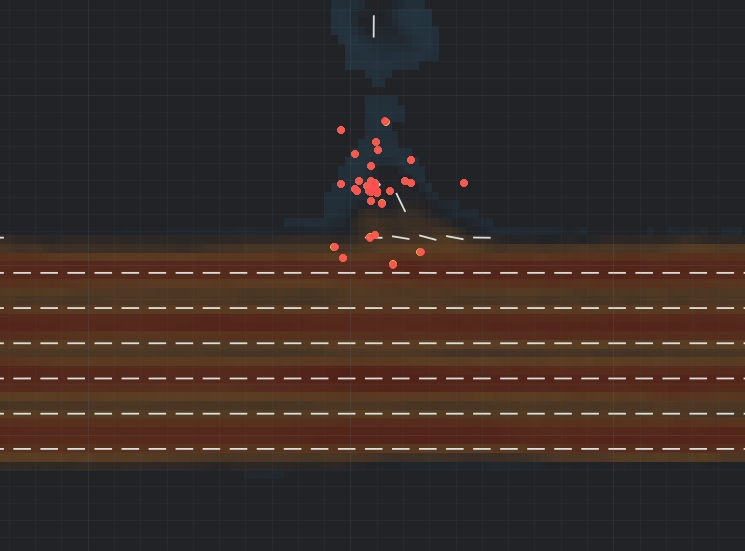
These examples use an attention head whose learned head gate converges close to one, as described in the supplementary analysis.
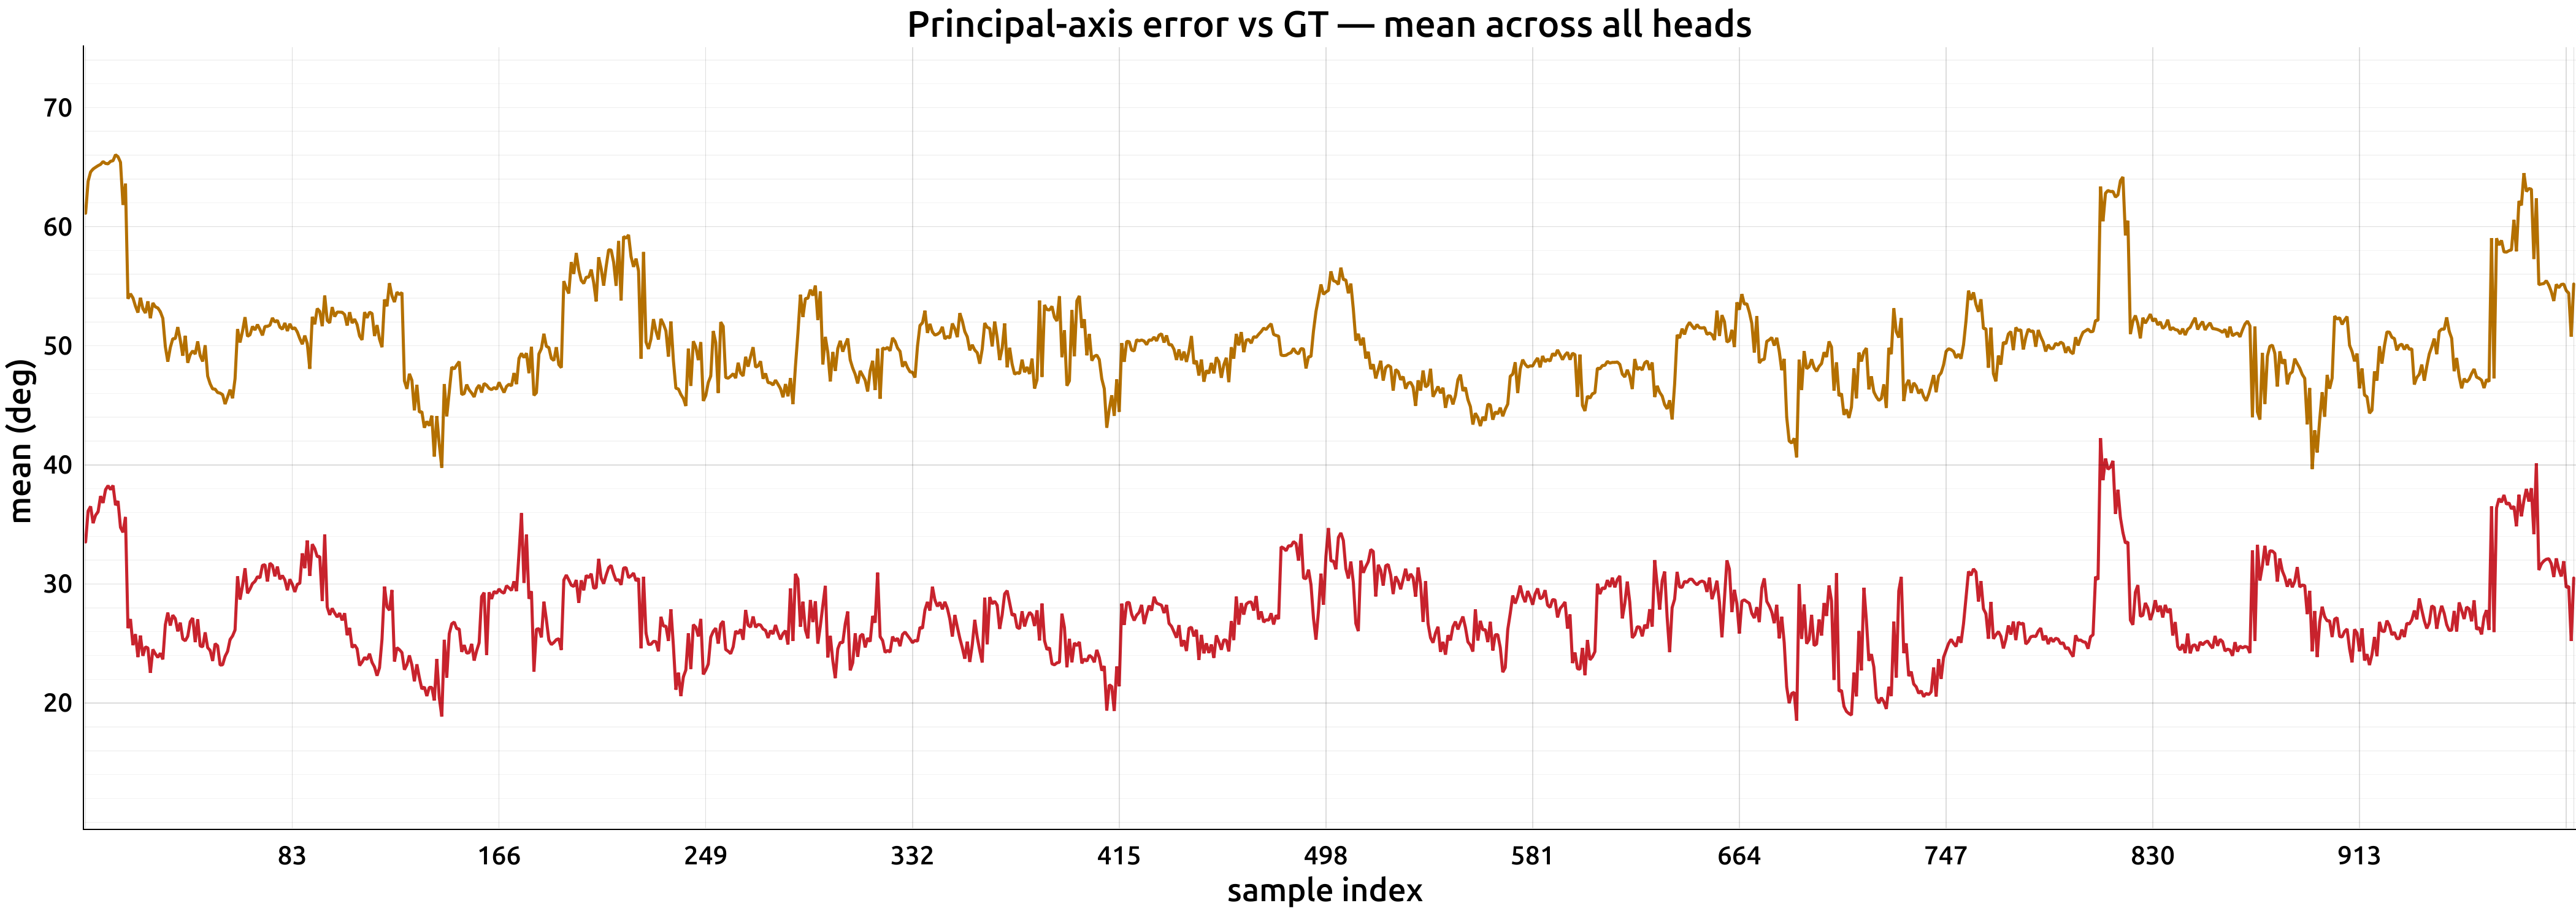
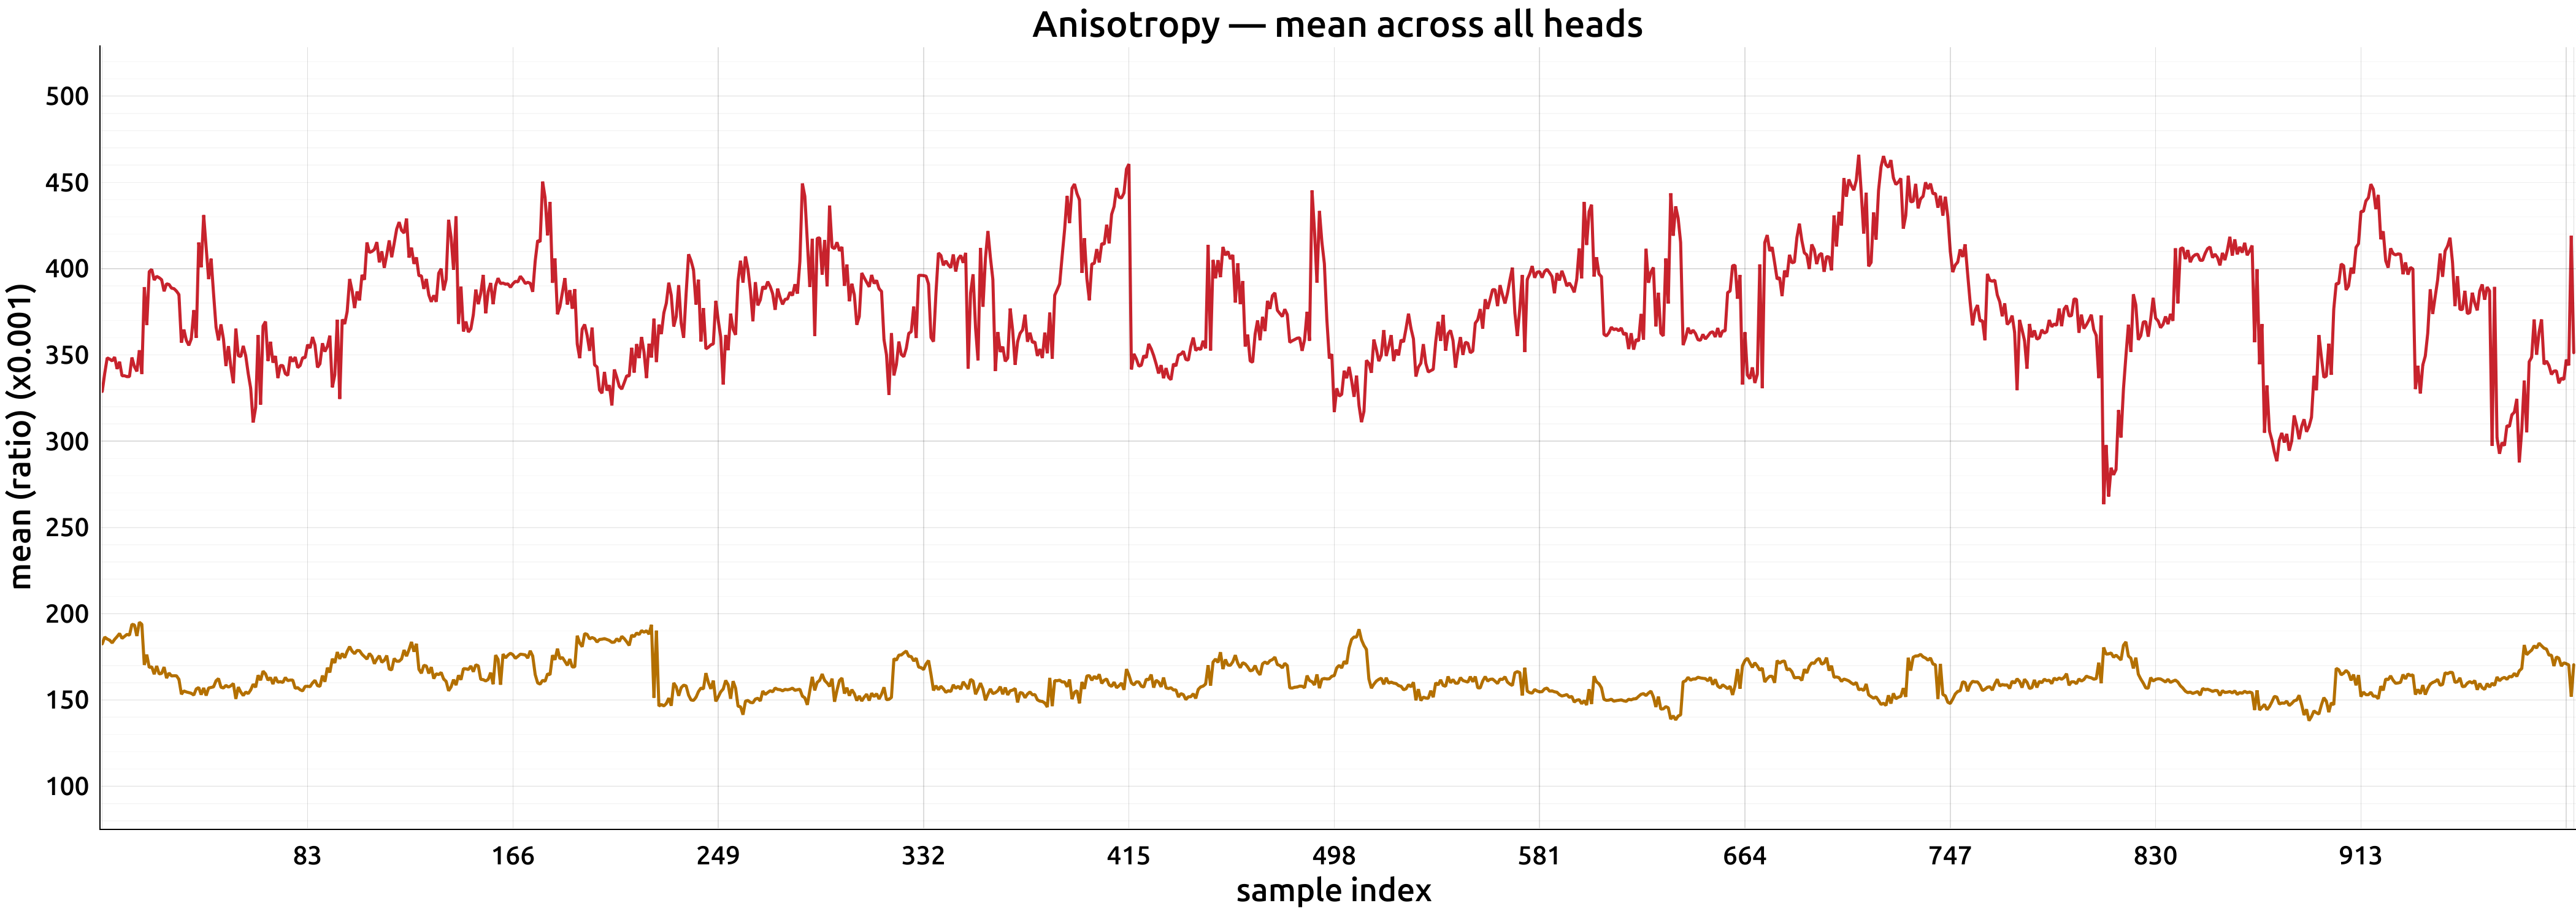
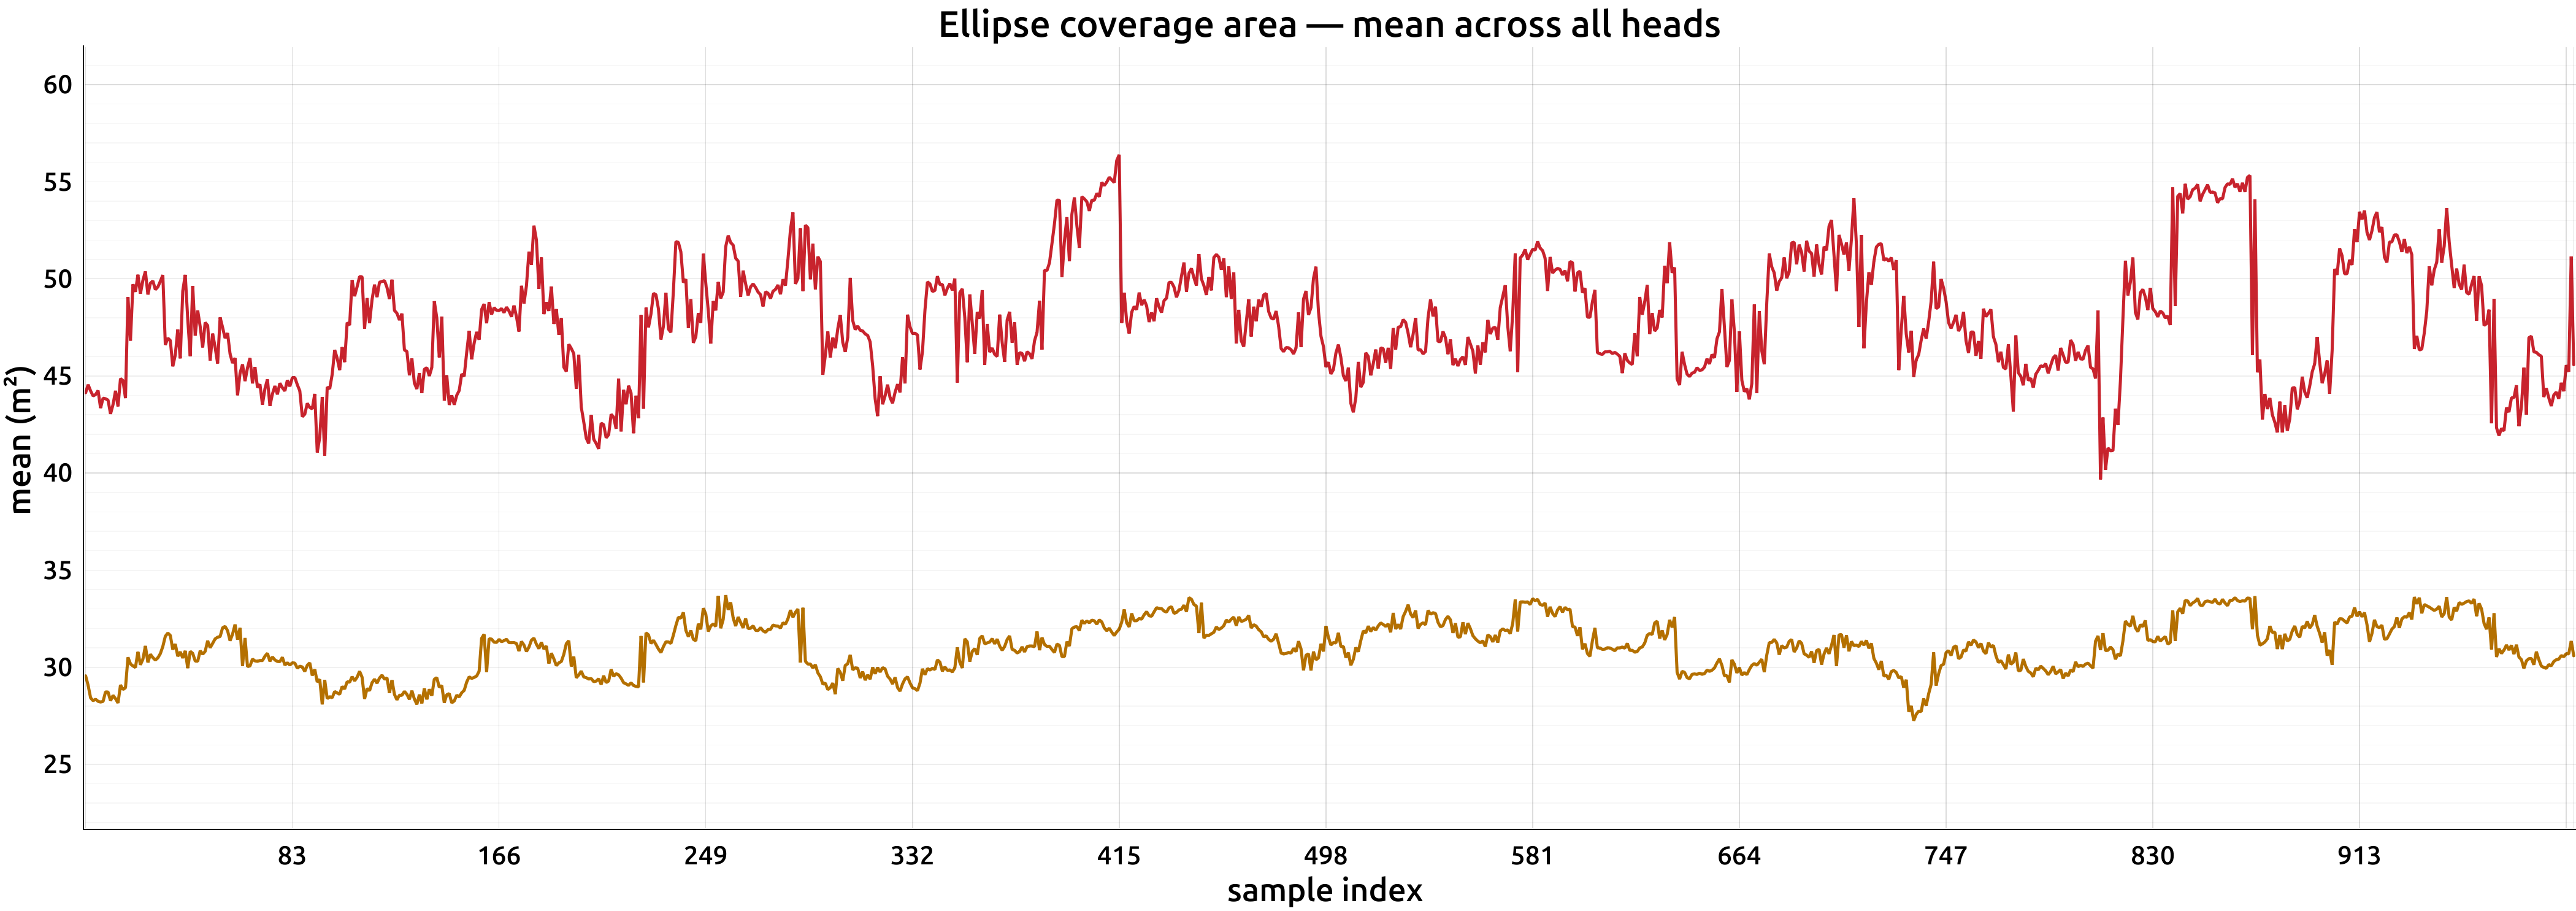
Attention measurements across 1,000 validation samples
Original Lane Attention (orange) and guided attention (red), averaged across heads. The values below are the aggregate measurements reported in the supplementary table.
 Enlarge
 Enlarge
 Enlarge
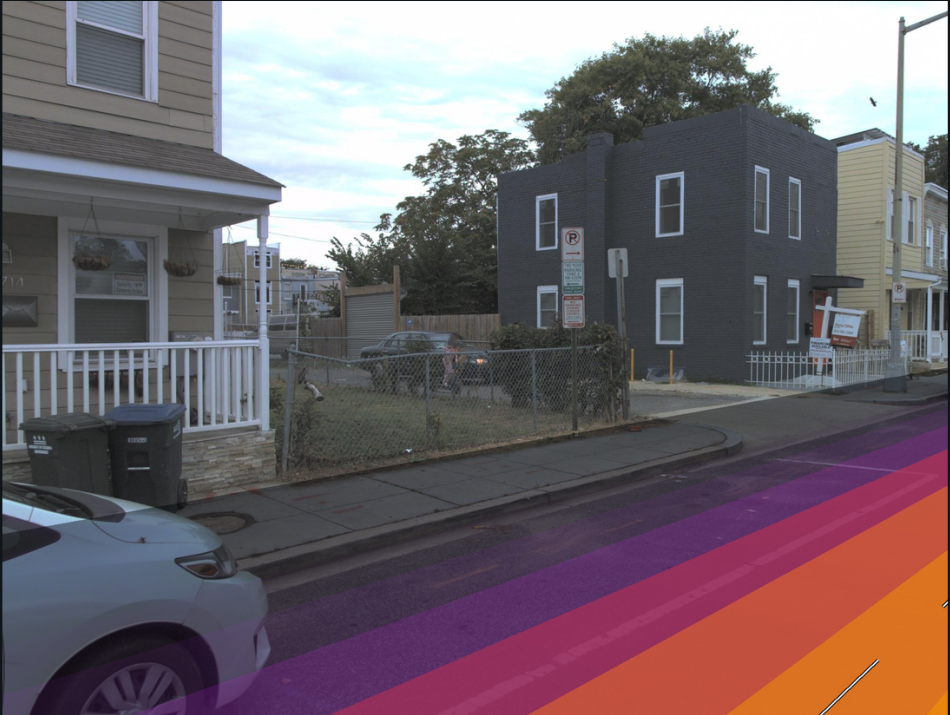
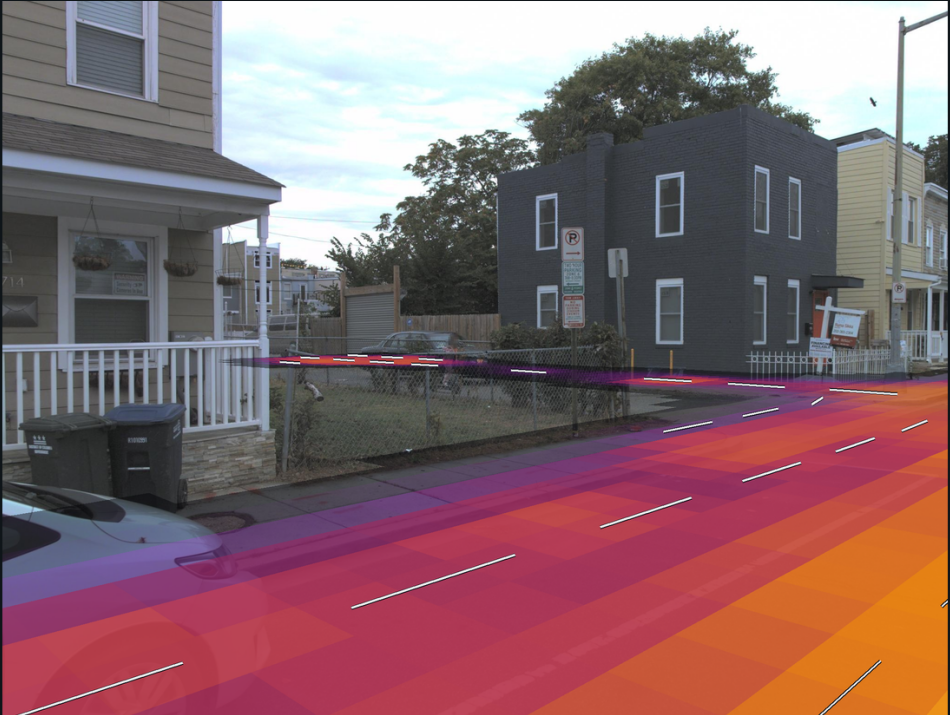
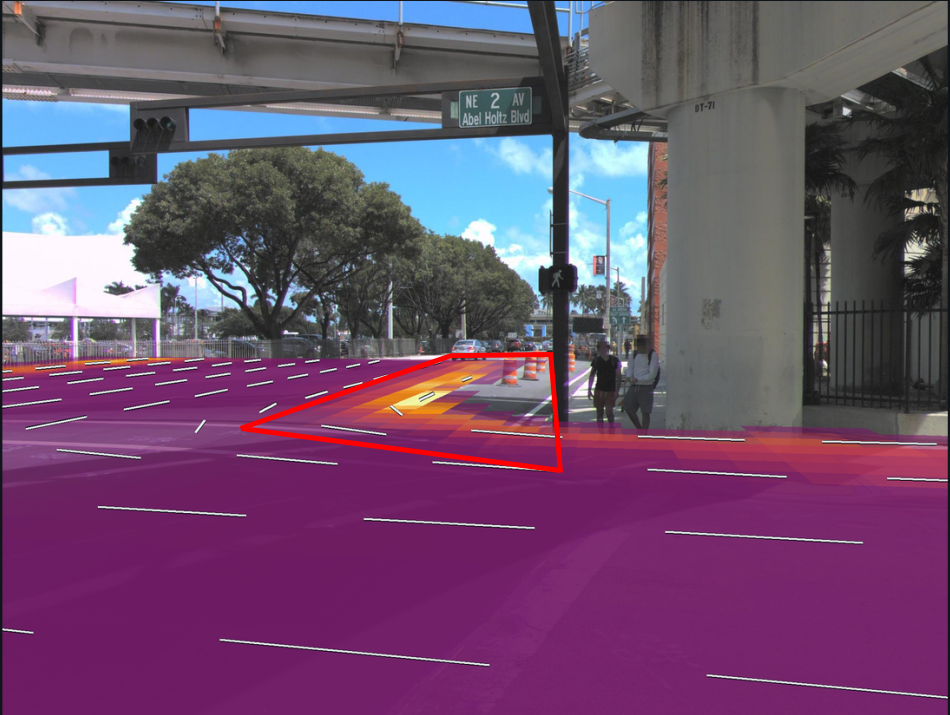
Knowing when the field is uncertain
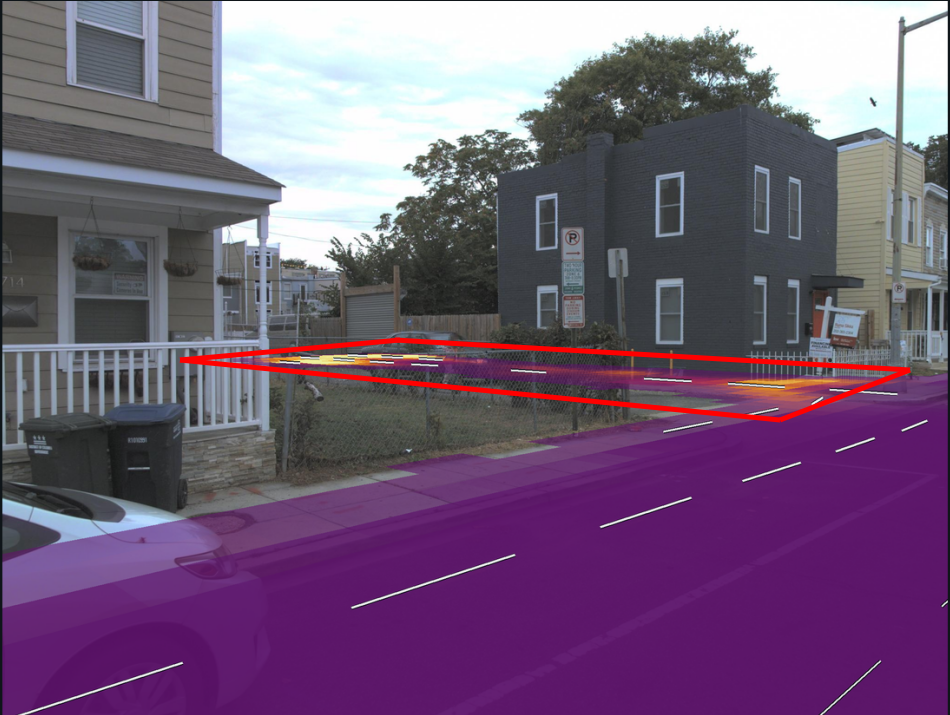
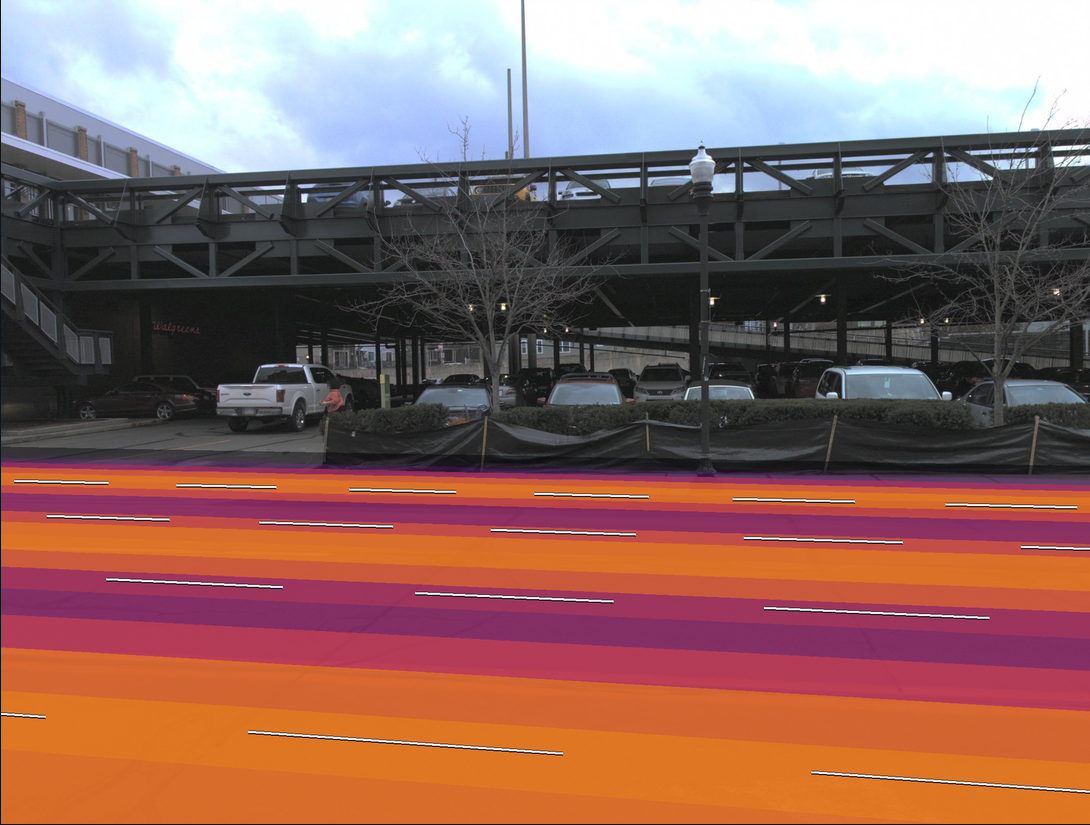
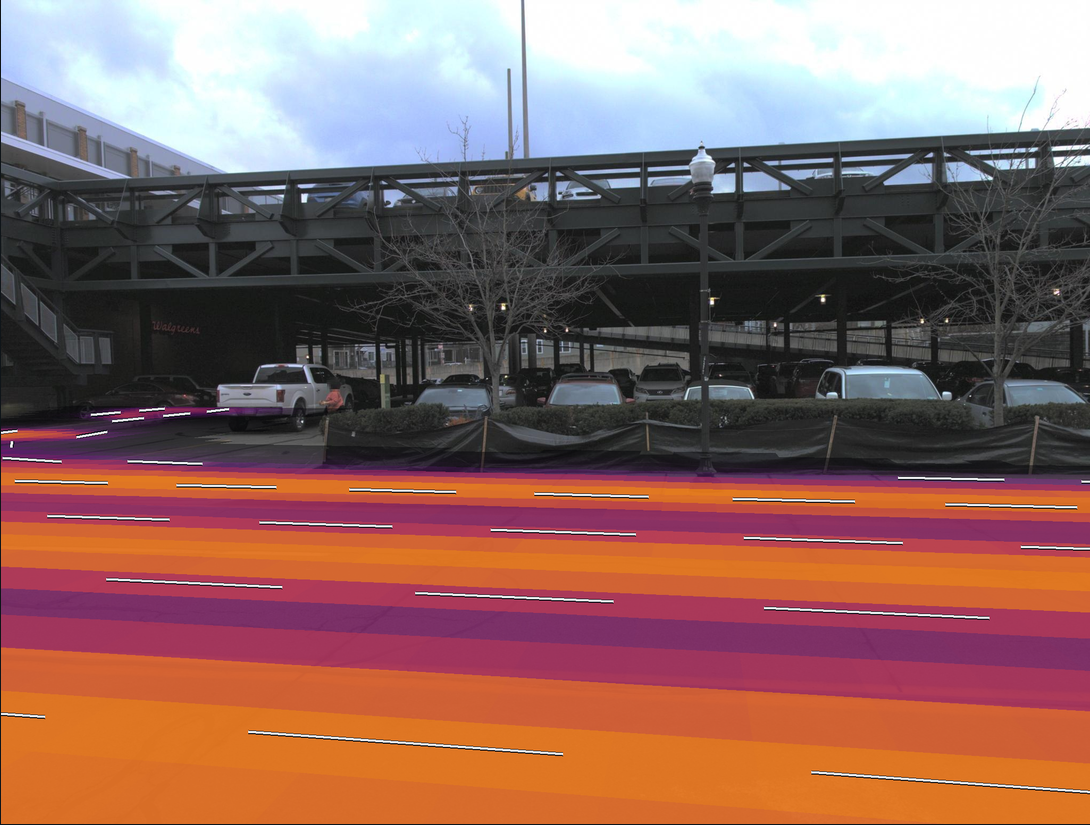
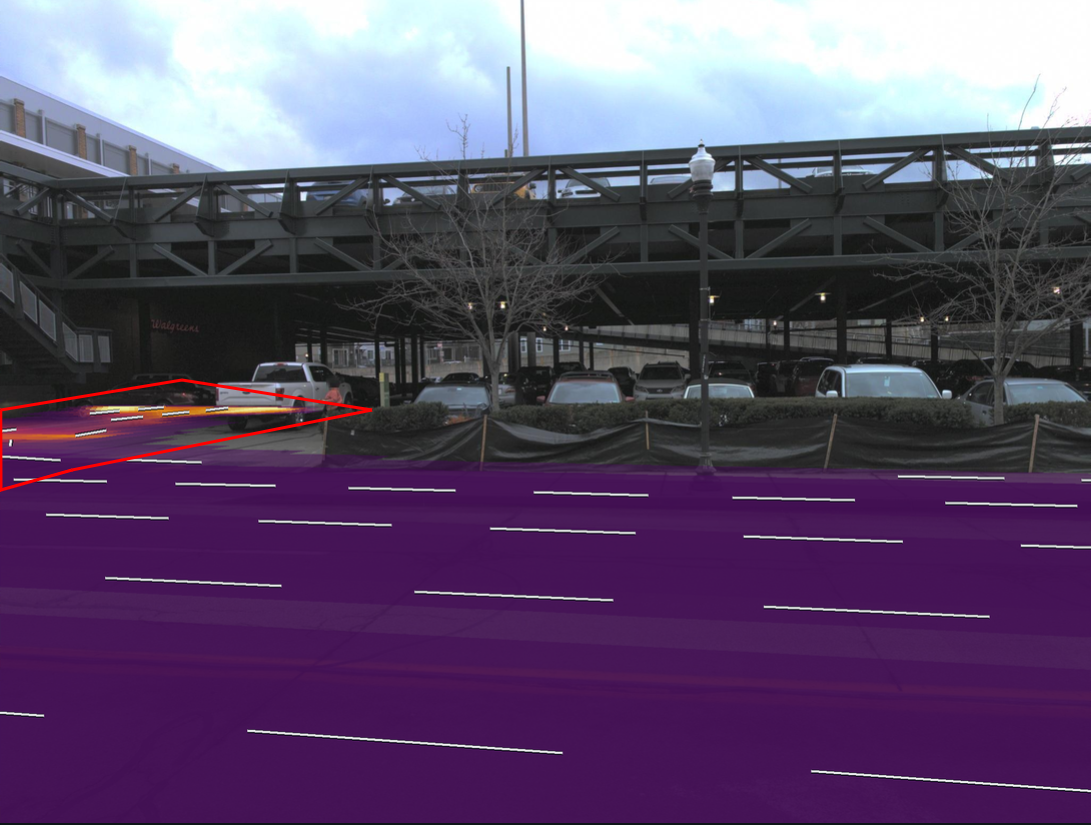
Predicted proximity can extend into regions that are not annotated as lanes. The predicted variance provides a separate reliability cue, allowing the downstream modules to reduce their reliance on uncertain geometry.
Experimental results
On OpenLane-V2 subset A, adding both modules increases LaneSegNet’s lane segment mAP from 32.1 to 36.1 (+4.0 points, or +12.5% relative). The following tables report the comparisons and ablations from the paper, including experiments on Argoverse 2 and nuScenes.
↑ Higher is better. Values in parentheses are absolute gains over the corresponding baseline; Δrel reports relative gains.
Swipe or scroll horizontally to view all table columns.
Comparison on OpenLane-V2
Lane segment and centerline perception on subset A. All models in this comparison use a ResNet-50 backbone and are trained for 24 epochs.
| Method | mAP ↑ | APls ↑ | APped ↑ | TOPlsls ↑ |
|---|---|---|---|---|
| StreamMapNet ‡ | 20.3 | 22.1 | 18.6 | 13.2 |
| TopoNet | 23.0 | 23.9 | 22.0 | – |
| SQD-MapNet ‡ | 26.0 | 27.1 | 24.9 | 16.6 |
| MapTR | 27.0 | 25.9 | 28.1 | – |
| MapTRv2 | 28.5 | 26.6 | 30.4 | – |
| LaneSegNet † | 32.1 | 32.2 | 31.9 | 25.5 |
| TopoLogic | 33.2 | 33.0 | 33.4 | 30.8 |
| Topo2Seq | 33.6 | 33.7 | 33.5 | 26.9 |
| LaneSegNet + Ours | 36.1(+4.0) | 35.8(+3.6) | 36.4(+4.5) | 28.4(+2.9) |
| Δrel vs. LaneSegNet | +12.5% | +11.2% | +14.1% | +11.4% |
| Method | DETl ↑ | TOPll ↑ | OLSl ↑ |
|---|---|---|---|
| MapTR | 17.7 | 5.9 | 21.0 |
| TopoNet | 28.6 | 10.9 | 30.8 |
| TopoMLP | 28.3 | 21.6 | 37.4 |
| TopoLogic | 29.9 | 23.9 | 39.4 |
| LaneSegNet † | 31.1 | 25.0 | 40.6 |
| TopoFormer * | 34.7 | 24.1 | 41.9 |
| TopoPoint † | 31.1 | 28.5 | 42.2 |
| Topo2Seq | 33.5 | 27.0 | 42.7 |
| LaneSegNet + Ours | 35.2(+4.1) | 28.0(+3.0) | 44.1(+3.5) |
| TopoPoint + Ours | 32.8(+1.7) | 30.0(+1.5) | 43.8(+1.6) |
Bold and underlined values indicate the best and second-best results, respectively, in each comparison. † Baseline trained from the official public implementation. ‡ Uses temporal information. * TopoFormer uses a pre-trained lane detector. “–” indicates no reported result.
Component-wise ablation Table 2
BEV feature modulation and deformable attention guidance each improve the baseline. Combining them provides the strongest results across all four metrics.
| Configuration | mAP ↑ | APls ↑ | APped ↑ | TOPlsls ↑ |
|---|---|---|---|---|
| LaneSegNet (baseline) | 32.1 | 32.2 | 31.9 | 25.5 |
| + Attention guidance | 33.2(+1.1) | 33.4(+1.2) | 32.9(+1.0) | 26.8(+1.3) |
| + Feature modulation | 34.9(+2.8) | 35.7(+3.5) | 34.0(+2.1) | 27.9(+2.4) |
| + Both (ours) | 36.1(+4.0) | 35.8(+3.6) | 36.4(+4.5) | 28.4(+2.9) |
Lane Fields from SD map priors Table 3
Lane Fields can also be constructed from the road polylines in standard-definition maps. Using the SD maps included in OpenLane-V2 improves both perception and topology over the LaneSegNet baseline.
| Method | mAP ↑ | APls ↑ | APped ↑ | TOPlsls ↑ |
|---|---|---|---|---|
| LaneSegNet | 32.1 | 32.2 | 31.9 | 25.5 |
| + Ours (SD) | 36.8(+4.7) | 36.6(+4.4) | 37.0(+5.1) | 29.7(+4.2) |
| Δrel vs. LaneSegNet | +14.6% | +13.7% | +16.0% | +16.5% |
Generalization across datasets and methods Table 4
We integrate Lane Field into MapTRv2 and GeMap for map element detection on Argoverse 2 and nuScenes, covering lane dividers, pedestrian crossings, road boundaries, and centerlines.
| Dataset | Method | mAP ↑ | APdiv ↑ | APped ↑ | APbou ↑ | APcen ↑ |
|---|---|---|---|---|---|---|
| Argoverse 2AV2 | MapTRv2 | 62.0 | 66.3 | 54.8 | 64.6 | 62.0 |
| + Ours | 64.2 | 69.5 | 56.4 | 67.1 | 63.6 | |
| GeMap | 70.3 | 74.6 | 66.7 | 69.5 | – | |
| + Ours | 71.2 | 75.3 | 67.4 | 70.8 | – | |
| nuScenesNUS | MapTRv2 | 55.8 | 55.9 | 52.5 | 60.1 | 54.9 |
| + Ours | 57.7 | 59.2 | 52.9 | 62.8 | 55.8 |
APdiv: lane dividers; APped: pedestrian crossings; APbou: road boundaries; APcen: centerlines. “–” indicates no reported result. On Argoverse 2, MapTRv2 is trained for 6 epochs and GeMap for 12; on nuScenes, MapTRv2 is trained for 24 epochs.
Resources
- Code & models
- Coming soon.
BibTeX
Contact
For questions about this work or research collaborations, use the form below to contact Andrea Bertogalli.